New Zealand Curriculum: Level 4
Learning Progression Frameworks: Statistical Reasoning, Signpost 4 to Signpost 5
Target students
These activities are intended for students who use a range of strategies for the addition, subtraction, multiplication, and division of whole numbers. They should recognise the difference between categorical and numerical data and have experience using the statistical inquiry cycle (PPDAC model).
The following diagnostic questions indicate students’ ability to make sense of numeric data. That includes using graphing technology and calculating simple measures of centre and spread. Allow access to pencils and paper. A calculator can be used to check answers if needed. (show diagnostic questions)
The questions should be presented orally and in a written form so that the student can refer to them. Students will need a copy of the scale to record their answers for question 1.
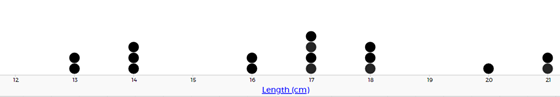
- A farmer measures the lengths of 20 carrots, in centimetres, to see that the crop is growing well.
Here are the measurements.
13, 13, 14, 14, 14, 16, 16, 17, 17, 17, 17, 18, 18, 18
Create a dot plot of the measurements using this scale.
(Show the dot plot from the next question as an example)
Signs of fluency and understanding:
Creates a correct scale that includes the range of the measurement data. Correctly plots the points on the scale to create a dotplot. The student may neglect to label the axis as length and may not include the units of measure (centimetres).
.
What to notice if they don’t solve the problem fluently:
Difficulties creating an appropriate scale that includes whole numbers in the range 13 – 21. This indicates that the student needs experience with using ‘broken’ scales, such as rulers starting with a non-zero number, and experience with constructing scales that include a given set of whole numbers.
Unsure about how to represent equal lengths as multiple points above the scale. For example, they may cluster the lengths of 17cm close to each other but arranged horizontally. This indicates that the student needs support with representing whole number data on a dot plot.
Supporting activity:
Building dot plots
All the students in Room Six sprinted 100 metres.
Their times in seconds are shown on this dot plot.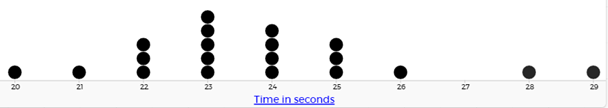
- How many seconds more did the slowest runner take than the fastest runner?
- What is the middle time for the students in Room Six?
Signs of fluency and understanding:
Identifies the times for the fastest and slowest runners as 20 and 29 seconds. Uses subtraction or adding on to find the difference in times as 9 seconds.
Approximates the middle as balance so chooses 23 or 24 seconds. May find the median by working from either end with the dots (actual median is 23.5 seconds).
What to notice if they don’t solve the problem fluently:
Unable to interpret the points as times of individual students. This suggests that the student needs further experience in constructing and reading dot plots.
Interprets points correctly but does not recognise that Question 2a requires them to find the difference. This suggests that the student needs experience with finding differences, particularly between two measurements.
Interprets the middle as halfway between the lowest and highest score, 24.5 in this case. This suggests that experience with finding the median by closing in from bottom and top is needed. Note: The concept of mean is developed through number balances and is more complex. Mean requires understanding that data points have greater impact on balance the further they are from the centre.
Supporting activity:
Finding the range and median
- This dot plot shows the weights of nine dogs at Doggie Daycare.
The weights, in kilograms, are 5, 10, 12, 20, 21, 24, 27, 38, and 72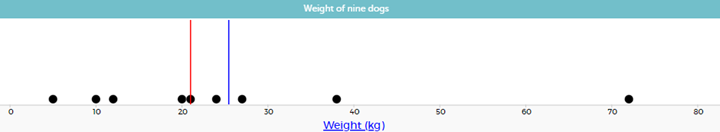
One line shows the median and the other line shows the mean.
Which line shows the median?
Which line shows the mean?
Explain how you know.
Signs of fluency and understanding:
Calculates the median by finding the fifth point from either left or right (21 kg). Concludes that the red line (lower of the two) shows the median, so the blue line shows the mean. If this thinking is demonstrated, use questioning to find out if the student knows how to calculate the mean.
Finds the median (21 kg) and calculates the mean (26 kg) by summing the weights and dividing by nine. Uses the calculations to decide which statistic is represented by each line.
Reasons that the mean must be higher than the median because of the outlier: the one dog that weighs 72 kg. This indicates a strong understanding of the effect that outliers have on the mean.
What to notice if they don’t solve the problem fluently:
Does not know how to calculate the mean, as a measure of centre.
Decides that the blue line shows the median because it is “more in the centre” than the red line (referring to the space between the lowest and highest weights). This indicates the student needs more experience with finding medians and recognising that the median locates in the centre of the space if points are evenly distributed and not clustered at one end of the distribution.
Supporting activity:
Applying medians and means
- This dot plot shows total scores that dancers earned at a Hip Hop competition.
The highest score possible was 50 points.
The red line shows the median for each group, dancers under the age of 20 years, and dancers 20 years and over.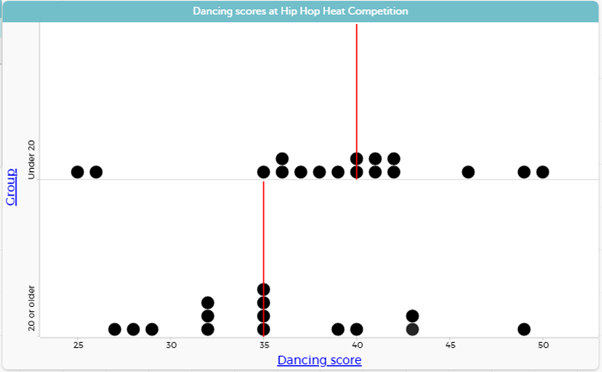
Which group were the better dancers?
Explain your answer using information from the graph.
Signs of fluency and understanding:
Uses the median to justify that the under 20 dancers earned more points, on average, than the 20 and over dancers. Discusses variation in some way, acknowledging that the scores of dancers in both groups vary a lot and the distributions overlap. May indicate the uncertainty of predicting that a chosen under 20 dancers will score more than a chosen 20 or over dancer.
What to notice if they don’t solve the problem fluently:
Focuses mostly on individual scores rather than the distributions or the medians. May say things like “this person (under 20) scored more than this person (20 and over). May use the highest and lowest scores as justification. For example, “The best under 20 dancers scored 10 but the best 20 and over dancer scored 49.” This indicates the student needs experience with describing and comparing distributions.
Supporting activity:
Applying measures of centre and spread to distributions