This is a level 3 and 4 statistics activity from the Figure It Out series.
A PDF of the student activity is included.
Click on the image to enlarge it. Click again to close. Download PDF (1137 KB)
make conclusions from charts
compare data sets
This diagram shows the areas of Statistics involved in this activity.
The bottom half of the diagram represents the 5 stages of the PPDAC (Problem, Plan, Data, Analysis, Conclusion) statistics investigation cycle.
Classmates
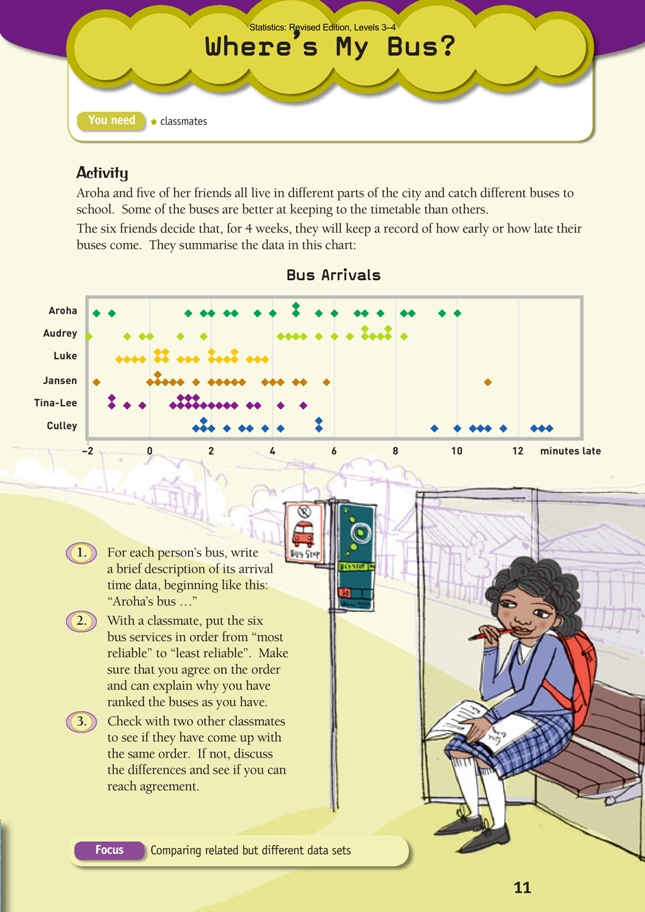
In this activity, students compare six graphically presented data sets. It may be the fi rst time that they have encountered a graph of this kind, but all it consists of are six dot plots with a common axis. The different presentation should remind them that there is more to graphing than pie charts and bar graphs. When confronted with data and no specifi c instructions about how to graph it, they should be flexible and, if necessary, creative when it comes to determining a style and format. This particular graph has a title and axis labels that are suffi cient and clear in the context, has minimal clutter, immediately conveys meaning, and invites detailed scrutiny. These
are all characteristics of good graphs.
With your students working in pairs, challenge them to make meaning of this graph with a minimum of assistance from yourself.
Note the use of “–2” on the time axis to denote an arrival that is 2 minutes early. Although this use may be unexpected, could it have any other meaning?
If help with question 1 is necessary, collaboratively develop a description for Aroha’s bus and then have the students write the other descriptions themselves. Encourage them to begin with the most important generalisation they can make (“Aroha’s bus was almost always late”) rather than details (“Twice, Aroha’s bus was between 1 and 2 minutes early”). They can then tease out their generalisation and add details.
Question 2 hinges on students knowing what “reliable” means in this context. It will help if they can imagine themselves waiting for each of these buses. Which would frustrate them most?
Question 3 is designed to encourage mathematical disputation. While “answers” are often not clear-cut (and will therefore vary), this is not the same as saying that any answer is good enough.
The students should expect to have to justify their ordering of the buses on the basis of the data and, if necessary, change it.
Using the PPDAC cycle, the students could conduct their own survey of local bus or train arrival times. Prompt them to consider who would be interested in this information.
Answers to Activity
1. Descriptions will vary, but possibilities include:
• Aroha’s bus was almost always late – by somewhere between 1 and 10 minutes.
Half the time it was nearly 5 or more minutes late. But Aroha couldn’t count
on it being late because twice it came a minute or two early. It never came exactly
on time.
• Audrey’s bus was generally between 4 and 8 minutes late. In fact, more than half the time, it was more than 5 minutes late. But on six occasions, it arrived within 2 minutes of the scheduled time.
• Luke’s bus always arrived somewhere between 1 minute early and 4 minutes
after the scheduled time. On nearly half of the mornings, it was within about
1 minute either side of the scheduled time. As long as Luke arrived 1 minute before the bus was due, he could expect to be on his way within 5 minutes.
• Jansen’s bus almost always arrived somewhere between the scheduled time
and 6 minutes later. On nearly half the mornings, he was on his way no later than
2 minutes after the scheduled time. On 1 day, the bus was nearly 2 minutes early;
on another, it was 11 minutes late. This lateness was exceptional. There must have
been some unexpected cause.
• Tina-Lee’s bus never arrived more than 5 minutes after the scheduled time. On
most days, it was at the stop no later than 2 minutes after the due time. It was a
little early on 4 mornings, by up to about 1 minute.
• Culley’s bus was always late. Half of the time, it was between 112
and 512 minutes late. The rest of the time, it was between 9 and 13 minutes late. On any given morning, Culley could never be sure whether the bus would be moderately late or very late.
2. Lists may vary. A possibility is:
Luke’s bus (most reliable)
Tina-Lee’s bus
Jansen’s bus
Audrey’s bus
Aroha’s bus
Culley’s bus (least reliable)
Explanations for the order may vary, but Luke’s bus was most consistently close to the scheduled time, whereas Culley’s was always more than 1 minute late and often 10 or more minutes late.
3. Discussion will vary.
Key Competencies
Where’s My Bus? can be used to develop these key competencies:
• thinking
• managing self
• relating to others.