This is a level 3 statistics activity from the Figure It Out series.
A PDF of the student activity is included.
Click on the image to enlarge it. Click again to close. Download PDF (1847 KB)
answer questions from a stem and leaf graph
collect data from a survey
construct a stem and leaf graph
make a conclusion
This diagram shows the areas of Statistics involved in this activity.
The bottom half of the diagram represents the 5 stages of the PPDAC (Problem, Plan, Data, Analysis, Conclusion) statistics investigation cycle.
Classmates
These activities require the students to analyse the data displayed in a graph and to consider reasons for some of the features evident in the data.
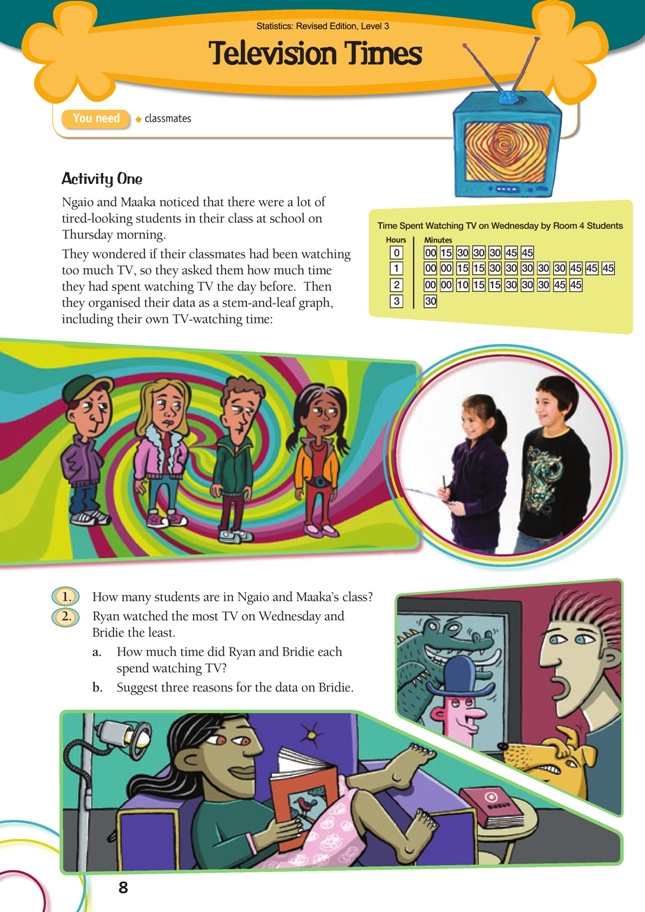
Activity One
For this activity, the students need to have prior knowledge of the stem-and-leaf graph, understanding how to draw this type of graph and recognising its important features. They should also know the difference between ordered and unordered stem-and-leaf graphs. As an extension, you could introduce them to back-to-back stem-and-leaf graphs.
You could also use this activity to introduce mode and median.
The data shown in Ngaio and Maaka’s stem-and-leaf graph is well clustered and has no real outliers. The mode is 1 hour and 30 minutes. Because there is an even number of data values in this activity, the median will be midway between readings 15 and 16, both of which are 1 hour and 30 minutes. So the median is 1 hour and 30 minutes. This means that half the students in the class watch TV for this amount of time or less and the other half watch TV for this amount of time or more.
Be aware that some of the statements in question 3 pose questions of interpretation. These include: (i) and (iv) by “most” do we mean a simple majority (“more than half”) or “nearly everyone” or somewhere between these two defi nitions?; (iii) by “30 minutes” do we mean “exactly 30 minutes” or “at least 30 minutes”?; and (vii) by “200 minutes” do we mean “exactly 200 minutes” or “at least 200 minutes”?
Allow your students to fi nd these issues for themselves and get them to justify the decisions they make.
Activity Two
This is a teacher-directed activity. Once the data is collected, the students need to sort it into a stem-and-leaf graph, working either individually or in groups. They should start with an unordered graph and then create a second graph in which the leaves are ordered.
If your students need a challenge, you could consider collecting a greater range of data (data relating to several variables) and then using this database to try and answer a wider range of questions.
When students gather data from their peers for this activity, have them examine their results to look for clusters and outliers. What could explain the outliers? How are the mode and median affected by signifi cant outliers? What if three people were to watch 4 hours of TV, as in the following distribution?
The graph above shows that more than half of this class (10 out of 18) watch less than 2 hours of TV each night. Because the number of students represented by the graph is an even number (18), the median viewing time is midway between students 9 and 10 (midway between 1 hour 30 minutes and 1 hour 45 minutes), which is 1 hour 37 1/2 minutes.
Answers to Activities
Activity One
1. 30 (unless someone was absent that day) because there are 30 “leaves” on the graph.
2. a. Ryan: 3 hours 30 minutes. Bridie: no time (0.00)
b. Suggestions will vary. For example, Bridie’s family may not have a TV; there
may have been nothing on that she wanted to watch; she might have been engrossed in an exciting book; she might have gone to the movies, been out with her family, been at swimming or basketball practice, or been involved in some other necessary or preferred activity.
3. i. True because, of the 30 students, only 9 watched 1 hour or less on Wednesday.
ii. False because, apart from the fact that 5 students watched no more than 30 minutes of TV, the data relates to a single evening (a different picture might be revealed if data was collected over a week).
iii. The statement is false if you take it to mean “the number who watched 30
minutes but no more than 30 minutes” (because only 3 students watched exactly
30 minutes of TV). The statement is true if you (reasonably) assume that everyone
who watched 30 minutes or more of TV is to be included. (Note that the statement
is also false if you thought because 12 boxes had 30 in them that this meant
that 12 students watched TV for 30 minutes – that thinking ignores the “stem” part of
the stem-and-leaf graph.)
iv. True, if by “most” we mean “more than half”. 16 out of 30 is more than half.
v. True: Ryan was the student. (He watched for 3 hours 30 minutes.)
vi. True because all the students except for one watched TV on Wednesday.
vii. False because 200 minutes is (3 × 60) + 20 or 3 hours 20 minutes. Only one student (Ryan) watched more than this amount.
4. Discussion will vary. To answer the question about their viewing, students had to try and remember what they did the previous evening. They may have found it diffi cult to remember. People may also minimise or exaggerate their viewing, perhaps because they are embarrassed to admit how much time they spent in front of
the TV or they want to show off.
Activity Two
1.–2. Answers will vary.
3. a. Questions will vary. You might want to investigate what time your classmates start watching TV or what their favourite programmes are.
b. Answers will vary. For example, you might need to ask your classmates to keep
a log of their viewing for a week or to write down (in order) a list of their
favourite programmes. (You don’t actually need to do this investigation, although
you could!)
Key Competencies
Television Times can be used to develop these key competencies:
• managing self
• relating to others.