This is a level 3 statistics activity from the Figure It Out series.
A PDF of the student activity is included.
Click on the image to enlarge it. Click again to close. Download PDF (1516 KB)
pose a question
sort and display data on a graph
make a conclusion from the data
This diagram shows the areas of Statistics involved in this activity.
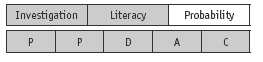
The bottom half of the diagram represents the 5 stages of the PPDAC (Problem, Plan, Data, Analysis, Conclusion) statistics investigation cycle.
A copy of the data cards (see copymaster)
Classmates
A computer spreadsheet/graphing program (optional)
This activity focuses on the importance of asking good questions. At this level, students should be able to write and answer summary and comparative investigative questions.
One of the most difficult aspects of conducting a survey is making sure that the survey questions you ask give you the data you need. Using the three data card questions in this activity, discuss:
• What is being asked?
• What sorts of answers will be given?
• Who will be interested in the results?
Emphasise that any investigation starts with a purpose and ends with conclusions and/or actions.
“What is your favourite spare-time activity?” appears to be a reasonably straightforward question, but the students need to consider how those being surveyed might respond. If there is a clear favourite, there is no problem. But if those surveyed list lots of different activities, it might be diffi cult to discern a favourite. To avoid this problem, surveyors often offer a list of responses (perhaps with an “other” option) and ask respondents to select one. In such cases, the question is “closed” rather than “open”.
You may need to remind the students how data cards are used to summarise information that is collected.
Be aware that questions such as “I wonder if there is a relationship between height and foot length?” involve understandings and require tools that are not normally introduced at this level.
A summary question for this activity might be: “I wonder what the typical bedtime for a student is?” (The use of “typical” leaves scope for a variety of measures and attributes of the variable [“bedtime”] to be investigated.)
A comparative question for this activity might be: “I wonder if girls tend to go to bed later than boys?”
To help the students complete question 2, you will need to review the kinds of graph that are likely to be useful and appropriate for this situation. Strip graphs, dot plots, stem-and-leaf graphs, bar graphs, and frequency tables normally show a single variable but can be paired (or in the case of a bar graph, have double bars) so that comparisons can be made for a second variable. While computers make it very easy to create certain standard types of graph (for example, pie chart and bar graph), computer graphs can be diffi cult to customise. Many graphing programs will not create dot plots.
Question 3 is a whole-class activity that requires your involvement in the planning process.
The students need to fully understand the PPDAC cycle. The task could be extended to allow the students (possibly in groups) to collect the data and work through each stage of the investigation cycle.
Answers to Activity
1. Questions will vary. For example, “I wonder if more boys than girls list playing sport as their favourite spare-time activity?” or “I wonder how many people go to bed at 9 p.m. or later?”
2. Practical activity. Results will vary. For example, a dot plot could be used to show bedtimes and answer the question “I wonder what time most people went to bed?” It might look like this: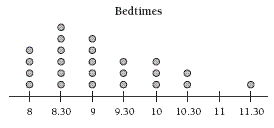
This dot plot shows that 14 out of 24 people went to bed at 9 p.m. or later.
3. Practical activity. Questions and data will vary, but you need to give full statements and back them up with data and graphs.
Key Competencies
It’s on the Cards can be used to develop these key competencies:
• thinking
• using language, symbols, and texts
• participating and contributing.