The key idea of patterns and relationships at level 5 is that graphs and equations which represent a relationship between variables connect with each other in key and consistent ways.
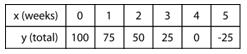
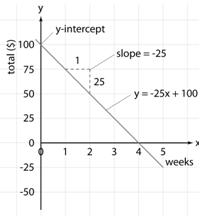
Linear relationships can be expressed in the equation form y = mx + c, where m is the gradient of the graph of the relationship, and c is the y-intercept. It is important for students to understand the connections between the graphs and equations of a relationship and the context to which it relates. For example, y could represent the total savings, m the consistent amount saved or spent every week, x the number of weeks of saving or spending, and c the amount in the savings account at the beginning. As an example, $25 is spent every week, and the beginning amount is $100:
 |
 |
 |
This key idea is extended to the key idea of patterns and relationships at level 6 where the students explore the effects of transformations on functions.