Purpose
This unit explores the relationships between decimals and whole numbers and fractions. A number of representations are used including double number lines, ratio tables and place value tables. The main objective is to link students’ knowledge of fractions with the decimal system.
Specific Learning Outcomes
- Represent fractions as decimals and vice versa.
- Explain why recurring decimals occur.
- Apply decimals to measurement contexts such as finding capacities.
Description of Mathematics
Fractions can be thought of as either numbers or operators. Decimals are a special set of fractions used to represent parts of a whole unit. The denominators of decimals are powers of ten, tenths, hundredths, thousandths, etc. The most common situations in which decimals are used involve measurement. Creators of the metric system used base units like the metre and litre, then created part units for greater precision. For example, 1 millilitre equals 1/1000 of 1 litre and 1cm equals 1/100 of 1 metre.
In this unit a ratio interpretation of the whole is used. One way to express the approach is to consider fractions of a set. The unit begins with a uniform one in the form of paper strips divided into different numbers of equal parts. In the first session students can choose to connect division of the number of parts with their preferred way to find common fractions of a fixed length. The use of a fixed one allows for fractions to be ordered by size on a number line. Therefore, the fractions are expressed as measures of that one unit.
The next sessions involve variable units of one as the set size changes. Recognising fractions as a relationship between part/s and a whole is critical to understanding. Decimals are introduced as part-whole relationships when the whole is constrained to ten, one hundred, one thousand, etc. Ratios are used to develop the concept of decimals as both numbers and expressions of a part-whole relationship. For example, the colour ratio 2:3 is two fifths red and three fifths yellow. Making two copies of the ratio gives 4:6 which is four tenths (0.4) and six tenths (0.6). More complex ratios require copying until a whole of 100, 1000, …can be found.
In this unit, students come to see that some fractions have a decimal representation that terminates, and some fractions have a decimal representation that repeats forever. For instance, 1/2 = 0.5 and this decimal terminates. 1/3 = 0.333… and the 3s continue without end, so the decimal is non-terminating.
Students are shown how to go from a fractional representation of a number to its decimal representation and vice versa. There is more than one way of finding these representations. A double number line (with fractions on one side and decimals on the other) and ratio tables are used as supportive representations.
A similar unit to this, which develops the fraction-decimal ideas further, can be found in Getting Percentible, Level 4.
Opportunities for Adaptation and Differentiation
The learning opportunities in this unit can be differentiated by providing or removing support to students, and by varying the task requirements. Ways to support students include:
- providing physical materials so that students can anticipate actions, and justify their solutions
- connecting multiple representations, particularly double number lines, ratio tables and equations
- using important mathematical vocabulary to discuss concepts, in particular words for fractions (numerator, denominator) and decimals (tenths, hundredths, thousandths, etc.), and equality/equivalence
- encouraging students to collaborate in small groups and to share, and justify, their ideas.
Tasks can be varied in many ways including:
- altering the complexity of the fractions and decimals that are used. Fractions that can be expressed as tenths and hundredths are easier than those requiring thousandths or further decimal places
- maintaining a fixed whole (Sessions One and Five) is much easier conceptually than altering the whole (Sessions Two, Three and Four)
The contexts for this unit can be adapted to suit the interests and cultural backgrounds of your students. Decimals arise through measurement. Therefore, you might choose measurement situations that are significant to your learners rather than rely on the generic contexts presented in the unit. For example, the length of pathway (te ara) or river (awa) may be culturally significant, or the length of fish (ika) or eels (tuna) may be a more appropriate food to share. The contexts for ratios can also be varied. Ratios made from people, plants or other creatures may be more motivating than the use of replaceable leads in pencils. The recurring patterns in tapa cloth, or other designs such as kōwhaiwhai, may provide a more appropriate context for copying a ratio. The numbers of males and females who play different sports or engage in different hobbies or cultural pursuits also provide convenient ratios to use.
Te reo Māori vocabulary terms such as mehua (measure), rita (litre), ritamano (millilitre), hautanga ā-ira (decimal fraction), hautanga (fraction), haurua (half), hautoru (third), hauwhā (quarter), taurunga (numerator), and tauraro (denominator) could be introduced in this unit and used throughout other mathematical learning.
Required Resource Materials
- Sticky labels
- Cardboard packets
- Unifix cubes TM
- Calculators
- Paper strips made from Copymaster 1
- One litre plastic drink bottles
- Large plastic drinking glasses (around 500 mL)
- Capacity measurement containers
- Rubber bands
- Permanent markers
Activity
Session 1
In this session we use paper strips to help us solve fraction problems.
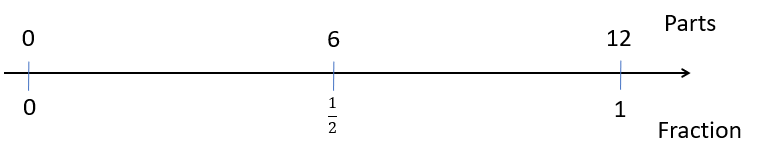
- Use Copymaster 1 to produce paper strips with various divisions across the bottom. Enlarge the copy to A3 size so the strips are easier to handle. Be sure that students cut the strips around the exact outside, and do not leave extra length. Introduce the activity by saying that a new company is producing fruit strips with cutting marks. This modification is to make equal sharing of the strips between friends much easier. You might use another context instead such as making a tuke (cubit) long measurement stick or dividing an eel up to share it among whānau members. Here is a 12-mark strip. Ask, "How could these marks be used to find half of the strip?"
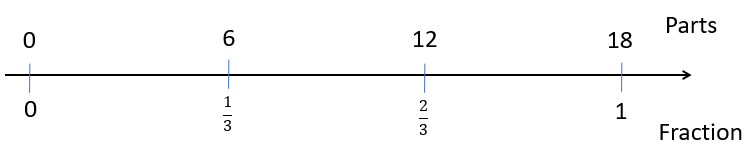
- Students should suggest that folding would be easy and that the fold mark will line up with the 6. Draw this action as a double number line like the one below. Use a paper strip to draw the number line so all numbers are located correctly to scale.
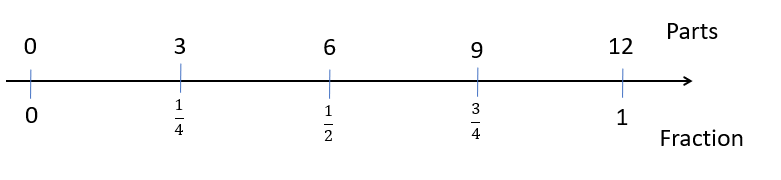
- Ask: What other fractions are easy to fold with this strip?
Students should suggest quarters, thirds and possibly sixths. Use their responses as an opportunity to add fractions to the number line. Include unit (denominator of 1) and non-unit fractions, like three quarters. For example:
- Write the equation for the halving problem as 1/2 x 12 = 6. Explain that the equation means “One half of 12 equals 6.”
- Ask students to record how the other fractions of 12 might be written as equations. For example, 3/4 x 12 = 9 and 2/3 x 12 = 8.
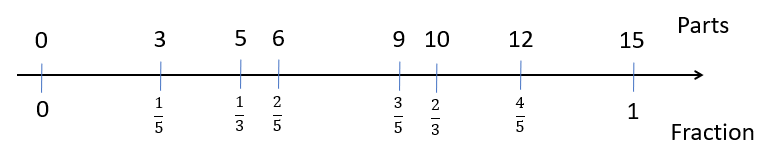
- Ask students to use the 15 parts strip.
What fractions would be easy to fold with this strip? Why would those fractions be easy?
Students might suggest that thirds and fifths are easy because 15 divides equally by 3 and 5. Ask them to work in pairs, folding one strip into thirds and one into fifths.
- Ask students to work together to create a number line that includes thirds and fifths, including the fractions with more than one as the numerator (non-unit fractions).
- Draw students’ attention to important features of the number line with questions like:
Where would the fractions 3/3 (three thirds) and 5/5 (five fifths) go? (These are equivalent fractions for one, just like 2/2 and 4/4)
How would you find one half of this strip? How many thirds and fifths are equal to one half? Folding in half yields 1 ½ / 3 (one and one half thirds) and 2 ½ / 5 (two and one half fifths).
Are the thirds in the same position on this number line, with 15 parts, and on the previous number line with 12 parts? Why does that happen? (Since both strips were the same length, the same fractions align).
- Ask students to record some fraction multiplication problems for the 15 part strip. For example, 2/3 x 15 = 10 (two thirds of 15 equals 10).
- Share the equations. Ask students to justify their equations using the strip model. Does a student record, 1/2 x 15 = 7 ½?
- Set the students a few closed problems to solve using the fruit (paper) strips:
- 1/3 x 24 = ?
- 2/5 x 15 = ?
- 2/3 x 18 = ?
- 1/2 x 28 = ?
- 4/10 x 30 = ?
- 2/5 x 25 = ?
- Open up the task so it is group worthy.
Choose a strip we have not used as a class. Use that strip to create a number line with at least six different fractions.
or
Create a fruit strip that can be folded into many different fractions, using the lines.
What number of parts is a good choice? Why?
- After a suitable time, discuss students' attempts. You might staple the strips that groups create on the wall, vertically aligned.
- Eyeball some fractions and record them:
Which fraction is greater in this trio; 2/5, 4/10, 1/5? How do you know?
The discussion might provoke the concept of equivalent fractions, and help students to realise that the size of a fraction is determined by the size of both the numerator and denominator.
- Tell the students that an employee at the fruit strip company invented the 17 part strip or use the measurement stick or eel scenario. His boss is not convinced that the 17 part strip is useful. Is the boss correct? (Seventeen is a prime number so the only fraction the strip can be divided evenly into is seventeenths).
Session 2
- In this session students solve fraction problems using division. The variation in this session is that the whole set is variable. This provides a contrast to session one in which the whole strip length was kept constant. Students also build on the concept of fractions within ratios.
- Tell the students that they are working for the company that makes endless pencils. These pencils have a variety of leads that can be pushed through the body of the pencil until the required colour is found. Tell six students to make each make a pencil containing three yellow leads and one blue lead. The students make a stack of coloured cubes to represent each pencil. Put the "endless pencils" into a cardboard packet (e.g. a Milo Box).
- Ask: What fraction of the leads (cubes) in this box are yellow? (three-quarters).
Do students realise that each unit of four pencil leads is three quarters yellow so the whole set must be three quarters yellow?
There are 24 leads altogether. How many of them are yellow?"
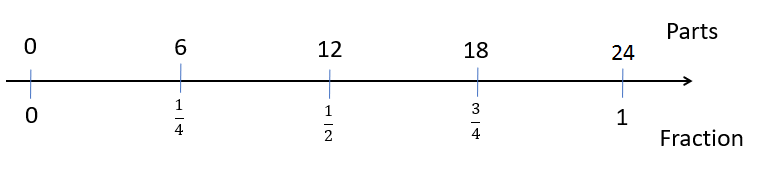
- Allow the students time to attempt the problem and then discuss their strategies. Some may derive the result from one-half, "One-half would be 12, so one-quarter is 6, so three-quarters is 18." Others may use a division strategy; "I knew that there are six pens. There are three yellow leads in each pen so that is six times three, that’s eighteen." Remind the students that what they have solved could be represented as an equation, as a double number line, and as a ratio table, as shown below:
- Equation: 3/4 x 24 = 18.
- Double number line:
Ratio table:
| Number of parts | 24 | 6 | 12 | 18 |
| Fraction | 1 | 1/4 | 1/2 | 3/4 |
- Prepare other examples of packets of endless pencils.
- Eight pencils (stacks of cubes), each with two red and three black leads (box labeled: 40 leads. Two red and three black are in each pencil. How many black leads are there altogether?")
- Six pencils, each with two green and one yellow leads (box labeled: "18 leads. Two green and one yellow are in each pencil. How many green leads are there altogether?")
- Seven pencils, each with five blue and three red leads (box labeled:"56 leads. Five blue and three red are in each pencil. How many blue leads are there altogether?")
- Ten pencils, each with three blue and seven white leads (box labeled:"100 leads. Three blue and seven white are in each pencil. How many blue leads are there altogether?")
- With each packet take two pencils out to show the students the kind of pencil inside. Encourage students to use whatever strategy they think is appropriate to solve each problem. Use equations, double number lines, and ratio tables to record the strategies as they are reported back.
For example, problem ii) might be solve like this:- Equation: 2/3 x 18 = 12 or 4/6 x 18 = 12
- Double number line:
Ratio table:
| Number of Parts | 18 | 1/3 | 2/3 |
| Fraction | 1 | 6 | 12 |
- Provide packets, labels, and cubes so that groups of students can make up similar pencil problems for other groups to solve. The problems can be exchanged. Ask the solver group to discuss their solutions with the creator group.
- Conduct a plenary for your students where you share important connections among ways to represent fractions. Highlight these points:
- The pencil shown below has a ratio of 2 grey leads to 3 white leads.
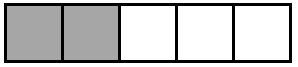
- The relationship of colours can be written as a ratio 2:3 and as fractions 2/5 grey and 3/5 white.
Why are the fractions fifths? - If the ratio is copied this results in a range of pencils that all have the same fraction of grey and white. For example, the ratio below is 6:9 (three copies of 2:3).

- The longer pencil is still 2/5 grey and 3/5 white though the fractions could be expressed as 6/15 and 9/15.
- The number of grey leads could be worked out using 2/5 x 15 = 6.
How could the number of white leads be worked out in this way?
The operation involves 15 ÷ 5 = 3 to find one fifth of 15, then 2 x 3 = 6 to find two fifths of 15.
How could the number of white leads be worked out in this way?
- Pose similar practice problems for your students.
Session 3
- In this session students transfer their knowledge of fractions to create tenths, hundredths, thousandths and ten-thousandths. In doing so, they connect fraction and decimal notation.
- Write 4 567 on the board and ask the students to tell you what they know about the number. Some will mention the place values (thousands, hundreds, tens, ones). Ask what the next place value is to the left is and how they know that (ten thousands because that is ten times the place immediately to its right). Ask what the place to the right of the ones place is. Some students may know that the place is the tenths but encourage them to justify if (division by ten with each next place to the right).
- Make some stacks of connecting cubes that have one yellow and one red cube (a model for halves).
What fraction of the stacks are yellow? (one half).
In order to express one-half as a decimal we need to find an equivalent fraction for it that is so many tenths.
How can we show one-half as tenths?
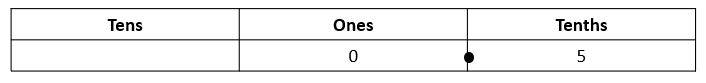
Students might know that five stacks will show one-half as five-tenths. If this knowledge has not yet been developed, spend some time using Deci-cubes, number lines, or another appropriate material to reinforce the relationship between one-half and five-tenths. How do we write one-half as a decimal?
Most students will know that the decimal for one half equals 0.5 but will not recognise the connection to tenths. Record the decimal as:
- Ask several students to produce stacks of cubes that have one blue to four white.
What fractions are in this ratio? (Students should say one fifth and four fifths)
Could we copy this ratio until we have tenths? (two copies will make a collection ten cubes)
How many cubes will be blue and how many will be white?
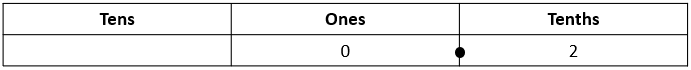
What are the decimals for one fifth and four fifths? (0.2 and 0.8)
What are the decimals for two fifths and three fifths? (0.4 and 0.6)
- Show how the fractions of fifths can be expressed as decimals by counting in lots of two tenths on the place value chart.
- Follow a similar process with quarters. Ask all students in your class to make stacks of one black cube and three white cubes.
Can the ratio be repeated until there are ten parts, tenths? (No)
What is the decimal place to the right of the tenths? (Students may notice the symmetry about the ones place or realise that dividing ten parts each into ten parts give hundredths)
Can the ratio be repeated until there are one hundred parts, hundredths? (Yes)
How many copies of 1:3 are needed? (25)
How many of the 100 cubes will be black? (25/100) How many will be white? (75/100)
What are the decimals for one quarter, and three quarters? (0.25 and 0.75)

- You might show why the fractions are expressed as tenths and hundredths. Repackaging 25 black tubes into two towers of ten and five cubes shows how the notation works. Each tower is one tenth of the total collection of 100 cubes. Do the same thing with the white cubes to form seven towers of ten (7 tenths) and five cubes (hundredths).
What is the decimal for two quarters? Why? (Students will know that two quarters equal one half and the decimal for one half equals 0.5)
If one quarter equals 0.25, then two quarters equals 0.50. Why is two quarters shown as 0.5? (A calculator will discard unneeded zeros)
- Tell the students that you are going to give them some commonly used ratios. Their task is to identify the fractions within the ratios and work out the decimal for each fraction. They may use cubes, number lines, and place value tables but they may not use a calculator. Write up the following ratios:
- 1 red cube: 9 blue cubes (one tenth: nine tenths)
- 4 green cubes: 6 yellow cubes (four tenths: six tenths)
- 3 black cubes: 5 orange cubes (three eighths: five eighths)
- 6 red cubes: 2 blue cubes (six eighths: two eighths)
- 2 white cubes: 1 green cube (two thirds: one third)
- After a suitable period of investigation, discuss their answers. Important points to bring out are:
- The decimal place to the right of the hundredths is the thousandths place.
- As the places include more parts it is easiest to use multiplication to figure out the decimals, e.g. 125 copies of eight cubes make 1000.
- Equivalent fractions have the same decimals, e.g. 6/8 = ¾ = 0.75.
- Decimals for some fractions have recurring digits and do not terminate, e.g. 1/3 = 0.3333….
Session 4
In this session we use calculators to explore the links between fractions and their decimal equivalents.
- Many students will know that calculators can be used to convert fractions into their decimal equivalents. Model this with some well-known fractions such as 1/2, 1/4, 2/5 and 3/8.
The decimal for one-half can be found by entering 1 ÷ 2 = .
Why does the operation one divided by two give the answer of one half, 0.5?
If one anything is partitioned equally into two parts, one of those parts equals one half.
The decimal for one-quarter can be found by entering 1 ÷ 4 =
- Ask: How can the decimal for three quarters be found?
The decimal for three-quarters can be found by entering 1 ÷ 4 = then multiplying the answer by three (3/4 is three lots of one quarter). Alternatively, use the operation 3 ÷ 4 = 0.75.
- Tell the students that you are now going to go the other way round and give them some decimals. Their job is to find the equivalent fractions. that these decimals represent. Add that they may use any of the strategies used in the previous session, like the double number line, ratio table, or cube model.
- Write up the following decimals for them to explore:
0.6; 0.8, 0.3, 0.7, 0.75; 1.5; 1.25 (five quarters); 0.325 (three eighths); 0.875 (seven eighths); 0.6666….(two thirds); 1.2 (six fifths or 12 tenths); 0.8 (four fifths or eight tenths) , 0.4444…. (four ninths); 0.3125 (five sixteenths)
- Allow the students to work in pairs and to discuss their findings. It is important that they record their answers.
- After a suitable period of investigation, bring the class together to discuss their strategies. Encourage tuakana-teina by prompting more knowledgeable students to share their thinking with the whole class, or in small groups. Key ideas will be:
- Use of known fraction-decimal links to get at unknowns, e.g. 1/5 = 0.2 and 1/10 = 0.1 so 0.6 = 3/5 or 6/10
- Recognise that when a decimal is greater than one the corresponding fraction is improper, that is its top number (numerator) is greater than its bottom number (denominator).
- Recurring decimals (decimals where a section of the numbers repeat) indicates a fraction that cannot be expressed as an exact number of tenths, hundredths, thousandths, etc.
- If students experience difficulty with some decimals, suggest the use of scaffolding strategies. For example, when nothing in the decimal looks familiar explore the unit fractions until a useful decimal is found. In the case of 0.4444… finding that one ninth (1 ÷ 9 = ) 0.1111… is handy. Four lots of one ninth equals four ninths, 4 ÷ 9 = 0.4444…
- Use a double number line progression to find the fraction for a recurring decimal:
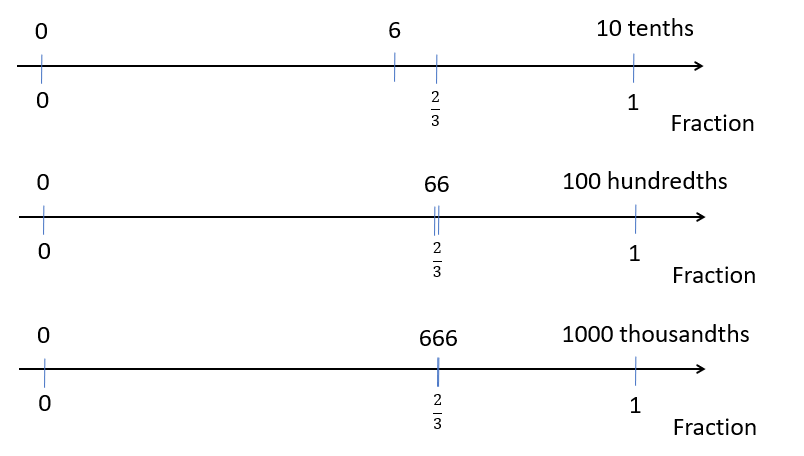
- Successive progressions make it easier to estimate the fraction accurately. In this case knowing one thirds equals about 33/100, so two thirds equals about 66/100. The fraction can be confirmed using mental calculation or the calculator, and altered to become more accurate, e.g. 333/1000 is closer to one third than 33/100.
Similarly a ratio table might be used to reduce a decimal to its simplest fractional form. For example, 0.875 by knowing this fraction equals 875/100.
Session 5
In this session students apply their knowledge of fractions, and their decimal equivalents, to solve problems involving litres and millilitres. The metric system is based on decimals, since it uses a base of ten.
- Ask the students to bring along 1 litre empty plastic drink bottles. Fruit juice often comes in 1 litre bottles which is preferable to 1L milk bottles that are not as regular. Ensure that a solid mark is shown on each bottle at the 1 litre point. Give students access to a set of measurement jugs so they mark accurately. Discuss the relationship between litres and millilitres. The litre is the base unit of capacity and is equivalent to the volume of a cube that measures 10cm x 10cm x 10cm (large place value block cube). Milli is the prefix for 1/1000 (one thousandth) so a millilitre is one thousandth of one litre. This relationship can be written as 1mL = 0.001L, or 1000mL = 1L.
- You might create an imaginary story for the task, such as the bottle being the emergency water supply that needs to be managed as they cross the desert or the ocean. Consider how this story can reflect the cultural make-up and interests of your class (e.g. when learning about the legend of Matariki and the six sisters, the bottle could represent the water collected by Ranginui to nourish the plants, animals and people). Tell the students that they will be given two 1 litre bottles, several rubber bands (to mark water levels), a marker, and a measurement jug. Their task is to mark one of the bottles to show where the water level would be if it was one-half full, one-quarter and three-quarters full, one-eighth, three-eighths, five-eighths, and seven-eighths full. Ask your students to use fraction symbols to make the marks, e.g. 3/8.
- Put the students in mixed achievement groups to solve the problem. Watch your students and look for the following:
- Do they recognise that decimals, thousandths can be used to accurately find the marks?
- Do they show understanding of tenth, hundredths, and thousandths?
- Do they label the marks appropriately with fractions (and possibly decimals)?
- After a suitable period of exploration, bring the class together to share their strategies. Some students may have used pouring methods to find the marks. For example, half can be found by splitting a full bottle equally between two bottles, one quarter can be found by splitting one half between two bottles, etc. Other students may have used the decimal properties of the metric measurement system. For example, to find the three eighths mark, they may realise that its decimal is 0.375 and so measure out 375 millilitres using the measurement jugs (Since there are 1000 ml in 1 litre).
- Ask how it might be possible to find the one-third and two-third marks if they had another bottle. Get them to predict approximately where these marks will be. Students should use their knowledge of ordering fractions to do this. For example, two-thirds is slightly more than five-eighths since 0.6666... is more than 0.625.
- Get the students to find the one-third and two-third marks by pouring between 1 litre containers rather than measuring. They might fill one container to the 1L mark, then share the contents equally among three same shaped containers (large plastic glasses are good for this task). Pouring one then two third shares into the original container gives the one third and two thirds marks. Then get them to check the accuracy of their pouring using measurement. One-third of a litre is about 333 millilitres. Recognise that students will not usually achieve that degree of accuracy by pouring.
- Extend the activity be asking for other fraction marks:
- Tenths are lots of 100mL (0.1L)
- Fifths are collections of two tenths (0.2L)
- Sixths are halves of thirds (0.1666…L)
- Ninths are thirds of thirds (0.1111…L)
- Optional. Extend the task using a large plastic refill bottle from a water cooler. These bottles vary in size and might be 12, 15 or 20 litres. Pose problems like:
- If the bottle is two thirds full, how many litres of water are left?
- If the bottle is a fraction fill, how many litres of water are left?
Home Link
Dear family and whānau,
At school this week we are learning about decimals, whole numbers and fractions. The main aim has been to link our knowledge of fractions with the decimal system.
At home this week I would like your child to write a list of real life examples of the use of fractions and decimals. Examples might be cooking recipes (including setting cooking times for a microwave based on the amount of meat), measuring to build or sew, money transactions, and times for sporting events, e.g. Olympic swimming records. We will use these for a class discussion.
Slosh, Dribble, and Plop
This unit helps students to understand the need for standard units of volume, and explores the context of trading with people on an imaginary island called Smati, where their measures are sloshes, dribbles, and plops.
Capacity is the amount of internal space within a container. The attribute of internal space is important to housing liquids and gases, though sometimes the volumes of luggage are given in units of capacity, e.g., 40L backpack.
The base unit of capacity is the litre. The litre is the amount of space equivalent to a cube that measures 10cm x 10cm x 10cm. One litre of water has a mass of 1 kilogram at sea level. Prefixes are used to create smaller and larger units from the base unit. The most common examples of these units are the millilitre (1/1000 of a litre), the microlitre (1/1 000 000 of a litre), the kilolitre (1000 litres or 1 cubic metre). In European countries it is common to encounter cL, centilitres (1/100 of 1 litre or 10mL). Note that in the New Zealand Curriculum document, the terms "volume" and "capacity" are used interchangeably.
The learning opportunities in this unit are very practical. Differentiation of tasks to meet the needs of students can occur in a variety of ways:
Tasks can be varied in many ways including:
The contexts for this unit can be adapted to suit the interests and cultural backgrounds of your students. Give purpose to the mathematics through context. For example, use containers that students are familiar with from their daily lives. Trading with a Pacific Island nation will mean more to students if they have whānau in places like Samoa, Tokelau, Niue, or Rarotonga, or have visited Pacific nations. Look for videos of Pacific Island nations to help students to interpret the context. The learning in this unit could also be linked to learning about early trading between Māori and Pākehā peoples. Also, consider when students use units of capacity, for tasks like cooking, catering at a party or feast, providing beverages for a sports team, or watering plants.
Session 1
Marama is planning her birthday party.
She wants to invite eleven friends so there will be twelve people at the party.
How many bottles of soft drink will she need to buy so that each person can have one drink?
(How much does a cup hold? 200mL, 250 mL, 300 mL, etc.)
It also depends on how much you are going to fill each cup.
Establish the capacity of a single cup, by measuring the amount of water it holds up to a suitable level. Pour the water into a measurement jug and read the scale.
Pour one cup of water from the bottle and invite the students to change their estimates if they wish. If the dot plot has been made with sticky dots on a whiteboard they can easily be rearranged.
Confirm the actual number of cups the bottle holds by pouring until it is empty. Compare the actual result to their estimates on the dot plot and invite them to explain what they notice.
Session 2
600 mL labelled 12 dribbles, 1 litre bottle labelled 4 plops,
1.5 L labelled 1 slosh.
In their groups students are to find out how they can change measurements in dribbles, plops and sloshes into metric units. Remind them to record their results.
Which Smati unit do you think is biggest? Why?
Which Smati unit do you think will be easiest to compare with our own units, litres and millilitres? Why?
How do you think dribbles, plops and sloshes are related?
How could you find out how many millilitres are the same as one plop?
12 dribbles = 600 mL, so 1 dribble = 50 mL
4 plops = 1 litre = 1000 mL, so 1 plop = 250 mL
1 slosh = 1.5 L = 1500 mL
How many plops make a slosh? (6)
How many dribbles make a slosh? (30)
Session 3
How much milk does your household use?
What size bottles does your family buy?
Why is that size good for your needs?
Session Four
What should be true about the price of a bottle of elixir?
Students should say that elixir is twice as expensive as milk for the same volume.
What does milk cost?
Is that the same amount for every 100mL? How could we find that cost per 100mL?
A Supermarket is now importing Smarti elixir. They wonder how much they should charge for a bottle.
How could they work out what to charge?
Take a specific bottle as an example (say a 3L juice bottle)
Ask: It says that this bottle holds 2 sloshes. Does that information help? What other information do we need?
So we should charge the cost of 3000 mL of milk? Have we forgotten something?
3000mL of elixir was traded for twice as much milk, 6000mL. How much does 6000mL of milk cost?
The pricing of bottles takes two steps:
Do the prices look right?
Which prices look correct? Which prices are possibly incorrect?
To improve your basic facts it is recommended that you drink 20mL of elixir per day.
How many days do these bottles of elixir last at that rate?
Session 5
Dear parents and whānau
In maths we are working on understanding volume and metric measures. Please can you help by sending your oddest shaped empty bottles to school with your child.
Smatians Problem
One of the problems that we have been working on with the class is the problem of the Smatians who are an imaginary group of people. The Smatians have a special type of juice (that comes from the Calculation tree). This juice gives them the power to add fractions together in their heads! Smatians keep the Calculation juice in funny shaped containers:
Have fun discussing with your child which is biggest; a cribble, a clop or a closh?
Have them work out the metric equivalent of cribbles, clops and closhes, and tell you how they worked it out.
Figure It Out Links
Some links from the Figure It Out series which you may find useful are:
Which graph?
In this unit students explore how bar graphs and pie graphs can show different aspects of the data. Bar graphs show the number differences between data categories and pie graphs can be used to clearly show proportional differences between data categories.
The learning opportunities in this unit can be differentiated by providing or removing support to students and by varying the task requirements. Ways to support students include:
The contexts for this unit can be adapted to suit the interests and cultural backgrounds of your students. Capitalise on the interests of your students. Food, sports, hobbies, and entertainment are appealing to most students.
Te reo Māori vocabulary terms such as kauwhata (graph), kauwhata pou (bar graph), raraunga whakarōpū (category data) and kauwhata porowhita (pie graph) could be introduced in this unit and used throughout other mathematical learning.
Getting Started
In this session students explore how the same data can be shown on a bar graph and a pie graph. They take a bar graph and rearrange it to make a strip graph and then use it to draw a pie graph. At the end of the session the students will have 3 graphs of the same data.
Exploring
Choose a graph
Activity 1
Refer to the bar and pie graph that students constructed in the previous session.
Ask the students questions, and ask which graph they used to answer the question:
For example: How many children walk to school? Which graph shows this best?
What percentage of children travel by car?
The school thinks about a third of the children come by bike, is this true?
How many more children come by bus than by car?
Discuss with the students why bar graphs are useful for showing the number of items and why pie graphs show proportions well.
Activity 2
Students are to make a bar graph and a pie graph for favourite spreads using the percentages given in the table below.
Check that they include titles on both graphs and labels on the axes of the bar graph.
Ask the students which type of graph they would use if they want to show:
Lucky Dip
Students are likely to have answered questions a, c and e using the bar graph, and questions b and d using the pie graph.
Writing and evaluating statements
Reflecting
In this final session students evaluate if statements are true about a graph and if the graph clearly illustrates the statement.
Using the data in the table below, students construct a bar graph and a pie graph of "Favourite things to do in the school holidays".
Dear parents and whānau,
This week we are exploring how bar graphs and pie graphs can show different aspects of data. Bar graphs show the number differences between data categories and pie graphs can be used to clearly show proportional differences between data categories.
Ask your student to give some examples of statements we could make about the data shown in a bar graph, and how this is different to statements we could make about the same data in a pie graph.
Cups and Cubes
In this unit students explore the use of cups and counters as a model to analyse the effects of operations rather than focusing on specific numbers.
Queensland researcher, Cyril Quinlan, published the use of cups and cubes as a model for algebraic thinking in 1995. Quinlan used the model to teach students about the manipulation of algebraic expressions.
The use of cups filled with “any chosen” number of cubes supports students’ conceptual development towards seeing letters as variables rather than as specific unknowns (Kucheman, 1981). Variables are measures that can vary. Research by Lauren Resnick (1992, 1993) suggested young children could understand the effects of simple operations on "protoquantities" that are unmeasured quantities. Examples of protoquantities include a container of cubes, or a jug of liquid. Students at Level 3 are capable of recognising the features of an expression or equation that remain unchanged when an operation is performed. They can recognise this without the need for ‘closure’ of knowing the amount of an unknown.
For example, If 3n + 2 = 17, two can be removed from both sides of the equality to simplify the relationship, i.e. 3n = 15.
This unit seeks to develop the use of cups and cubes as a model for students to analyse the effects of operations rather than focusing on the resulting answers. In doing so they attend to the structure of why patterns and relationships work.
Students can be scaffolded through the learning opportunities in this unit by differentiating the nature and complexity of the tasks, and by adapting the contexts. Ways to support students include:
The task can be varied in many ways including:
The contexts for this unit can be adapted to suit the interests and cultural backgrounds of your students. Cups and cubes are a physical model of variables and constants (set numbers). As such the model is devoid of realistic context. To engage students, you might use a story shell about magical mathematical cups that can hold different numbers of items (they can stretch or shrink). You might also vary the contexts of the start unknown problems by using the names of students in your class and contexts that they show interest in.
Te reo Māori vocabulary terms such as taurangi (variable), hononga (relationship), whārite rārangi (linear equation) and paheko kōaro (inverse operation) could be introduced in this unit and used throughout other mathematical learning.
Session 1
In this session students learn to use a cup containing cubes to represent a variable.
Draw up a table of values to organise the students’ responses. Note that students frequently neglect the options that have zero cubes in a cup. This task is an excellent opportunity to develop the concept of zero as the numbers representing ‘nothing of something.’
Ask students to explain why they think the points on the graph lie along a downward sloping straight line. They might notice that the value of the green cup variable goes down by one as the value of the blue cup variable goes up by one.
Using a range of different coloured cups and different numbers of cubes pose similar problems asking the students to come up with a table of values and a graph to represent the relations. The table below shows four examples of possible problems. The students should model the situation with actual cups and cubes to come with ordered pairs such as (1,3) to represent possible values that the variable may assume. Note that you are dealing with discrete variables (i.e. random variables that can take only distinct values, usually whole numbers). Therefore, the numbers of cubes should be whole numbers. Some students may consider fractions of cubes. Examples of useful relations might be:
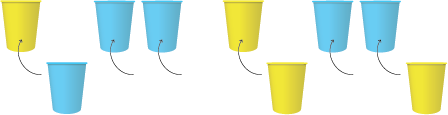
The red cup has two more cubes than the blue cup.
This linear relation is effectively r = b + 2
Each blue cup has the same number of cubes. The number of cubes in the yellow cup equals the total number in both blue cups.
This linear relation is effectively y = 2b (b multiplied by 2)
There are 18 cubes in total. Each yellow cup holds the same number.
This linear relation is effectively 18 = r + 2y
The number of cubes in the yellow cup equals the total number of cubes in all the blue cups.
This linear relation is effectively y = 3b (b multiplied by 3)
Note that in some of these relations, an infinite number of whole number values could be put in the table. For example, in the problem with one yellow cup an three blue cups, the table could read:
Session 2
In this session students explore the effect of operations on variables. Inverse operations are presented as “doing and undoing” processes.
Pose “think of a number” problems for students that result in some unexpected answers at the end. Encourage the students to reason why that occurs and discuss with a partner. The processes involved can be modelled using cups and cubes. Begin with a problem where the use of inverse operations is obvious. Note that the algebraic representation is not expected though you might use an empty box as n for a more accessible representation.
Ask: Why does everyone get an answer of five, no matter what starting number they thought of?
Do your students realise that subtracting n undoes the adding of n in the first place?
Develop more complex examples. Encourage the students to model the steps with cups and cubes to explain the effect of the operations.
For example:
Your answer is one!
Your final answer was one more than your starting number.
Tell your students that addition and subtraction, and multiplication and division are inverse operations. With the class, come up with a list of metaphors that describe inverse relationships (e.g. turning a light switch on and off).
Students also need to recognise when an operation is only partly undone. For example, with 3n + 6 dividing by three will undo multiplying n by three, but the addition of six is not completely undone. Demonstrate this for students.
Session 3
In this session students model equality with cups and cubes models. They investigate operations that can be performed on both sides of the equation, that simplify the relationship while maintaining equality.
Begin with simple equalities such as: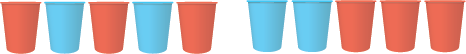
Each red cup has the same number of cubes and each blue cup has the same number of cubes. Which collection, left or right, has the most cubes?
Look for students to realise that structurally the collections are the same (Two blue cups and three red cups on each side). This can be provoked by putting different numbers of cubes into the cups, e.g. 3 cubes in each red cup, 8 cubes in each blue cup. The equality of the collections is preserved no matter what numbers are used.
Look for students to realise that taking away the same cups from each side leaves the equality maintained. Algebraically that is alike 3r + 2b = 2b + 3r so 2r + 2b = 2b + 2r (subtracting one red cup from each side)
Also consider what cannot be done. For example, removing a red cup from the left collection and a blue cup from the right collection does not maintain the equality.
Provide other examples where applying the same operation to both sides makes finding possible values for the variables much easier.
Each yellow cup holds the same number of cubes as every other yellow cup.

Each blue cup holds the same number of cubes as every other blue cup.
The left collection of cubes equals the right collection of cubes.
What numbers of cubes could be in the yellow and blue cups?
Simplifying both sides by removing the same cups makes the problem much easier.
In this case students are left with the equality that one blue cup equals two yellow cups (b = 2y). An infinite set of solutions like (0, 0), (2, 1), (4, 2),… is possible.
Get students to connect the concepts of variable and equality using group worthy problems like:
Each cup of a given colour, in both collections, must contain the same number of cubes, e.g. all reds hold 4 cubes, all yellows hold 3 cubes.
What numbers of cubes could be put in each cup so that the two collections contain the same total number of cubes?
Students might realise that the number of cubes placed in the red cups is irrelevant to the problem since it is the equivalence of two yellow cups to one blue cup that determines whether or not the collections are equal. They are likely to arrive at this conclusion by experimenting and looking for commonality among the solutions.
Solutions for r = 1 Solutions for r = 2 Solutions for r = 3
y = 0 so b = 0 y = 0 so b = 0 y = 0 so b = 0
y = 1 so b = 2 y = 1 so b = 2 y = 1 so b = 2
y = 2 so b = 4 y = 2 so b = 4 y = 2 so b = 4
y = 3 so b = 6 .... ....
What numbers of cubes for each colour of cup will make each collection equal?
(Two reds must equal one blue plus six)
What is in common with these solutions?
What numbers of cubes for each colour of cup make each collection equal? (One green plus one blue must equal one yellow plus three)
Session Four
In this session cups and cubes models are created to solve problems more traditionally associated with algebra. Students attempt to find specific unknowns from the information they are given.
Manaia began the weekend with some dollars in his money jar.
He worked all day on Saturday weeding Mr Barkley’s gardens.
After he was paid Manaia saw he had five times as much money as he had to start with.
On Sunday, he delivered advertising, and made an extra $12.
By the end of the weekend he had a total of $72.
How much money did he have at the start of the weekend?
Starts with some dollars… Then has five times as much…Then adds $12 to that amount
Students should suggest some undoing, using inverse operations. The order is important. The undoing needs to occur in the reverse order to the first operations.
Take $12 off each side:
Divide both sides by five:
Has Manaia got $72 or are we incorrect?
You might use a calculator to check (5 x 12 + 12 = 72)
Jodie collected lemons to squeeze juice. She started with a few lemons.
After she visited her Nana’s tree, Jodie had six times as many lemons as she had to start.
She got another 15 lemons from her neighbour.
Jodie’s Mum was a bit worried about her lemon collecting habit. She told Jodie to share her lemons equally with her two sisters.
“That’s fair,” said Jodie, “I still have 13 lemons to make juice.”
How many lemons did Jodie have at the start?
Session 5
In this session students use the cups and cubes model to solve problems from growth patterns. Matchsticks are used to create the figurative patterns.
Petra and Clive are looking at this matchstick pattern:
They have worked out that it takes 25 matches to make 12 triangles in this way. Their teacher has challenged them to work out how many matches 100 triangles might take to make.
What rules can you find to help Petra and Clive so they do not have to build 100 triangles?
Students are likely to come up with different direct rules that describe the relation between the number of triangles and the number of matches. For example:
With the cups and cubes model it is easier for students to appreciate the structural similarity of the rules in that one model can be converted to the others. For example, in the first rule if two of the three cubes are used to replace the two cubes taken out then the model becomes the second model. This is equivalent to proving physically that 2(n-1) + 3 = 2n + 1
How many matches would it take to make 20 houses in this pattern?
Rules might include:
Session 6 (extension session)
In this session students learn how cups and cubes models can represent why number relationships work.
Take any three consecutive numbers, e.g. 3, 4, 5.
If you add the numbers (3 + 4 + 5 = 12), this equals three times the middle number (3 x 4 = 12).
Does this work for any set of three consecutive whole numbers? Why?
Students may recognise that both collections total three lots of the first number plus three. Algebraically this could be written as, n + (n + 1) + (n + 2) = 3n + 3 = 3 (n + 1)
Choose any four consecutive odd numbers, e.g. 3 + 5 + 7 + 9.
Add the two outside numbers, e.g. 3 + 9 = 12.
Add the two inside numbers, e.g. 5 + 7 = 12.
Are the sums always equal no matter what consecutive odd numbers you choose? Why?
Would this work for consecutive even numbers? Why?
Pose other more complex problems that can be modelled with cups and cubes.
For example:
Choose any two single digit numbers, e.g. 3 and 8 (modelled by two different cups).
Use the digits to make two different two-digit numbers,
e.g. 38 and 83, 38 = 10 x 3 + 8, 83 = 10 x 8 + 3
Add the two sums, e.g. 38 + 83 = 121
Divide the answer by 11, e.g. 121 ÷ 11 = 11
The result is always the sum of the two digits, e.g. 3 = 8 = 11.
Does this always happen? Why?
Hint: If b is the first digit and r is the second digit, then a model of 10b + r looks like this.
What will the model of 10r + b look like?
Why will the sum of 10b + r and 10r + b equal 11 x (b + r)?
Dear parents and whanau
This week we have been exploring algebraic relationships through the use of cups and cubes. Your child may like to show you how they could solve the following problem:
Altogether Liam and Moana have 24 video games. Moana has twice as many video games as Liam. How many games might each person have?
Ask them to demonstrate some “think of a number” problems. Children were very surprised by the results that seemed quite magical.
Getting the point
This unit explores the relationships between decimals and whole numbers and fractions. A number of representations are used including double number lines, ratio tables and place value tables. The main objective is to link students’ knowledge of fractions with the decimal system.
Fractions can be thought of as either numbers or operators. Decimals are a special set of fractions used to represent parts of a whole unit. The denominators of decimals are powers of ten, tenths, hundredths, thousandths, etc. The most common situations in which decimals are used involve measurement. Creators of the metric system used base units like the metre and litre, then created part units for greater precision. For example, 1 millilitre equals 1/1000 of 1 litre and 1cm equals 1/100 of 1 metre.
In this unit a ratio interpretation of the whole is used. One way to express the approach is to consider fractions of a set. The unit begins with a uniform one in the form of paper strips divided into different numbers of equal parts. In the first session students can choose to connect division of the number of parts with their preferred way to find common fractions of a fixed length. The use of a fixed one allows for fractions to be ordered by size on a number line. Therefore, the fractions are expressed as measures of that one unit.
The next sessions involve variable units of one as the set size changes. Recognising fractions as a relationship between part/s and a whole is critical to understanding. Decimals are introduced as part-whole relationships when the whole is constrained to ten, one hundred, one thousand, etc. Ratios are used to develop the concept of decimals as both numbers and expressions of a part-whole relationship. For example, the colour ratio 2:3 is two fifths red and three fifths yellow. Making two copies of the ratio gives 4:6 which is four tenths (0.4) and six tenths (0.6). More complex ratios require copying until a whole of 100, 1000, …can be found.
In this unit, students come to see that some fractions have a decimal representation that terminates, and some fractions have a decimal representation that repeats forever. For instance, 1/2 = 0.5 and this decimal terminates. 1/3 = 0.333… and the 3s continue without end, so the decimal is non-terminating.
Students are shown how to go from a fractional representation of a number to its decimal representation and vice versa. There is more than one way of finding these representations. A double number line (with fractions on one side and decimals on the other) and ratio tables are used as supportive representations.
A similar unit to this, which develops the fraction-decimal ideas further, can be found in Getting Percentible, Level 4.
The learning opportunities in this unit can be differentiated by providing or removing support to students, and by varying the task requirements. Ways to support students include:
Tasks can be varied in many ways including:
The contexts for this unit can be adapted to suit the interests and cultural backgrounds of your students. Decimals arise through measurement. Therefore, you might choose measurement situations that are significant to your learners rather than rely on the generic contexts presented in the unit. For example, the length of pathway (te ara) or river (awa) may be culturally significant, or the length of fish (ika) or eels (tuna) may be a more appropriate food to share. The contexts for ratios can also be varied. Ratios made from people, plants or other creatures may be more motivating than the use of replaceable leads in pencils. The recurring patterns in tapa cloth, or other designs such as kōwhaiwhai, may provide a more appropriate context for copying a ratio. The numbers of males and females who play different sports or engage in different hobbies or cultural pursuits also provide convenient ratios to use.
Te reo Māori vocabulary terms such as mehua (measure), rita (litre), ritamano (millilitre), hautanga ā-ira (decimal fraction), hautanga (fraction), haurua (half), hautoru (third), hauwhā (quarter), taurunga (numerator), and tauraro (denominator) could be introduced in this unit and used throughout other mathematical learning.
Session 1
In this session we use paper strips to help us solve fraction problems.
Students should suggest quarters, thirds and possibly sixths. Use their responses as an opportunity to add fractions to the number line. Include unit (denominator of 1) and non-unit fractions, like three quarters. For example:
What fractions would be easy to fold with this strip? Why would those fractions be easy?
Students might suggest that thirds and fifths are easy because 15 divides equally by 3 and 5. Ask them to work in pairs, folding one strip into thirds and one into fifths.
Where would the fractions 3/3 (three thirds) and 5/5 (five fifths) go? (These are equivalent fractions for one, just like 2/2 and 4/4)
How would you find one half of this strip? How many thirds and fifths are equal to one half? Folding in half yields 1 ½ / 3 (one and one half thirds) and 2 ½ / 5 (two and one half fifths).
Are the thirds in the same position on this number line, with 15 parts, and on the previous number line with 12 parts? Why does that happen? (Since both strips were the same length, the same fractions align).
Choose a strip we have not used as a class. Use that strip to create a number line with at least six different fractions.
or
Create a fruit strip that can be folded into many different fractions, using the lines.
What number of parts is a good choice? Why?
Which fraction is greater in this trio; 2/5, 4/10, 1/5? How do you know?
The discussion might provoke the concept of equivalent fractions, and help students to realise that the size of a fraction is determined by the size of both the numerator and denominator.
Session 2
Do students realise that each unit of four pencil leads is three quarters yellow so the whole set must be three quarters yellow?
There are 24 leads altogether. How many of them are yellow?"
Ratio table:
For example, problem ii) might be solve like this:
Ratio table:
Why are the fractions fifths?
How could the number of white leads be worked out in this way?
The operation involves 15 ÷ 5 = 3 to find one fifth of 15, then 2 x 3 = 6 to find two fifths of 15.
How could the number of white leads be worked out in this way?
Session 3
What fraction of the stacks are yellow? (one half).
In order to express one-half as a decimal we need to find an equivalent fraction for it that is so many tenths.
How can we show one-half as tenths?
Students might know that five stacks will show one-half as five-tenths. If this knowledge has not yet been developed, spend some time using Deci-cubes, number lines, or another appropriate material to reinforce the relationship between one-half and five-tenths. How do we write one-half as a decimal?
Most students will know that the decimal for one half equals 0.5 but will not recognise the connection to tenths. Record the decimal as:
What fractions are in this ratio? (Students should say one fifth and four fifths)
Could we copy this ratio until we have tenths? (two copies will make a collection ten cubes)
How many cubes will be blue and how many will be white?
What are the decimals for one fifth and four fifths? (0.2 and 0.8)
What are the decimals for two fifths and three fifths? (0.4 and 0.6)
Can the ratio be repeated until there are ten parts, tenths? (No)
What is the decimal place to the right of the tenths? (Students may notice the symmetry about the ones place or realise that dividing ten parts each into ten parts give hundredths)
Can the ratio be repeated until there are one hundred parts, hundredths? (Yes)
How many copies of 1:3 are needed? (25)
How many of the 100 cubes will be black? (25/100) How many will be white? (75/100)
What are the decimals for one quarter, and three quarters? (0.25 and 0.75)
What is the decimal for two quarters? Why? (Students will know that two quarters equal one half and the decimal for one half equals 0.5)
If one quarter equals 0.25, then two quarters equals 0.50. Why is two quarters shown as 0.5? (A calculator will discard unneeded zeros)
Session 4
In this session we use calculators to explore the links between fractions and their decimal equivalents.
The decimal for one-half can be found by entering 1 ÷ 2 = .
Why does the operation one divided by two give the answer of one half, 0.5?
If one anything is partitioned equally into two parts, one of those parts equals one half.
The decimal for one-quarter can be found by entering 1 ÷ 4 =
The decimal for three-quarters can be found by entering 1 ÷ 4 = then multiplying the answer by three (3/4 is three lots of one quarter). Alternatively, use the operation 3 ÷ 4 = 0.75.
0.6; 0.8, 0.3, 0.7, 0.75; 1.5; 1.25 (five quarters); 0.325 (three eighths); 0.875 (seven eighths); 0.6666….(two thirds); 1.2 (six fifths or 12 tenths); 0.8 (four fifths or eight tenths) , 0.4444…. (four ninths); 0.3125 (five sixteenths)
Similarly a ratio table might be used to reduce a decimal to its simplest fractional form. For example, 0.875 by knowing this fraction equals 875/100.
Session 5
In this session students apply their knowledge of fractions, and their decimal equivalents, to solve problems involving litres and millilitres. The metric system is based on decimals, since it uses a base of ten.
Dear family and whānau,
At school this week we are learning about decimals, whole numbers and fractions. The main aim has been to link our knowledge of fractions with the decimal system.
At home this week I would like your child to write a list of real life examples of the use of fractions and decimals. Examples might be cooking recipes (including setting cooking times for a microwave based on the amount of meat), measuring to build or sew, money transactions, and times for sporting events, e.g. Olympic swimming records. We will use these for a class discussion.
Figure it Out Links
Some links from the Figure It Out series which you may find useful are:
Polyhedra (3D shapes)
In this unit students make and investigate a variety of polyhedra (3D objects) with a focus on making nets.
A polygon is a two-dimensional shape with straight sides. A polyhedron is a fully enclosed three-dimensional object with faces that are polygons. There are many different families of polyhedra, including prisms, pyramids, and Platonic solids.
Terms commonly used to describe the attributes of polyhedra include:
In the 1750’s Leonhard Euler discovered a famous relationship between these three properties. The number of vertices, plus the number of faces, take away two, equals the number of edges.
E = V + F - 2 (or V + F - 2 = E)
The learning activities in this unit can be differentiated by varying the scaffolding provided or altering the difficulty of the tasks to make the learning opportunities accessible to all students. Ways to support students include:
This unit is focussed on the construction of specific geometric shapes and as such is not set in a real world context. There are ways that it could be adapted to appeal to the interests and experiences of your students. For example, students could be given the opportunity to decorate a model of their favourite polyhedra solid in a style of their choosing for a class display. This could range from cultural motifs to favourite colours, patterns or images.
Your students might investigate the use of polyhedra in the real world through contexts such as playground equipment such as domes, shapes of crystals, construction of buildings such as wharenui, sculptures, and terrariums.
Te reo Māori vocabulary terms such as āhua ahu-toru (three-dimensional shape), āhua ahu-rua (two-dimensional shape), mata (face of a solid figure), akitu (vertex), tapa (edge, side), and the names of different shapes could be introduced in this unit and used throughout other mathematical learning.
Getting started
What do you know about this solid shape?
What shapes can you see? (Pentagons and hexagons)
Look at the vertices (corners). How many of each shape meet at one vertex? Is that combination the same for each vertex? (Two hexagons and one pentagon meet at each vertex.)
Slide two shows a cube. Show students a cube you have constructed from plastic polygons (polydrons, geoshapes, etc.) or card (see below).
What is this solid shape called? (a cube)
What shapes is it made from? (squares)
How many of those shapes are needed? (six)
How can you count the faces to check you count them all? (e.g. top and bottom, four faces around the middle.)
How many vertices does a cube have? (eight)
How did you count them?
How many edges does a cube have? (12)
Pose this challenge:
How many different solids can you make only using equilateral triangles or squares? Let's try to build solids that look balanced.
If needed, go back to the example of the soccer ball to provide an example of symmetric balanced solid.
Allow the students time to build the solids. After a suitable collection has developed, bring the class together. Look for the tetrahedron and octahedron.
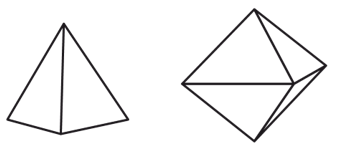
What is the same about these two solids? (made only of triangles)
The solid on the left is called a tetrahedron. What does tetra- means? (four)
The solid on the right is called an octahedron. What does octa- mean? (eight)
Point out that regular polyhedra are named by the number of faces.
Does anyone have a different polyhedron made only from triangles?
If a student has created an icosahedron (icosa- means twenty), draw the student's attention to it. If not, show slide four of PowerPoint 1.
Look carefully at each vertex of the three polyhedra we have made from triangles.
What do you notice?
Is it possible to put six triangles around each vertex and make a solid?
Have students try to see if it works.
Surrounding a vertex with six triangles creates a tessellation which covers a plane, or flat surface. The internal angles of an equilateral triangle all measure 60°. Six angles of 60° add to 360° which is a full turn and is "flat" when joined. Therefore it isn't possible to make a solid with six equilateral triangles at each vertex.
One of the students is likely to have made this polyhedra called a triangular dipyramid (made of two triangular based pyramids).
This solid does not belong with these (tetra-, octa- and icosa-). Why not?
If you count the number of triangles surrounding each vertex, what do you get?
Some vertices have four triangles meeting (around the ‘equator’) and some have three triangles meeting (top and bottom). There is not the same number meeting at every vertex which is a requirement for Platonic solids.
Other students are likely to have made these solids.
Draw your students’ attention to the configuration of polygons around each vertex. For the square based pyramid the apex has four triangles around it and each base vertex has a square and two triangles. A square based pyramid might be excluded from the set of balanced symmetrical solids because it is not balanced if it is sitting on one of its triangular sides. For the cuboctahedron there are two squares and two triangles around each vertex. For the rhombicuboctahedron there is one square and three triangles around each vertex.
For all of the balanced symmetric solids made from triangles and squares, ask your students to work out how many faces each solid has. For the tetra-, octa- and icosahedron the prefix names the polyhedron. However, counting the faces on the cuboctahedron and rhombicuboctahedron is a bit more challenging. Encourage your students to record their data systematically:
8 triangles
6 squares
8 triangles
18 squares
Session Two
What solids did we make?
As the students remember it, bring out a model of the solid and name it.
Explain that there is a special group of polyhedra called Platonic solids, that were found by the ancient Greeks. Explain that there are two criteria for a Platonic solid:
Note that regular means that the sides, therefore the angles, of the polygon are the same. Use chalk on the floor to draw this Carroll diagram and place the models within it. This is a complex classification, so you may need to support students to do it.
the same
The solids in the top left quadrant are perfect, the others are not.
What other shapes have you got in your set?
Can any other perfect solids be made with the other shapes?
Students might have found that hexagons do not work.
Why can you not make a perfect solid with hexagons?
At least three polygons are needed around a vertex. The internal angles of a hexagon measure 120°. Three lots of 120° totals 360° which is a full turn. Therefore, no angle is unfilled for the polygons to come off the flat as the sides are joined.
Imagine if I unpeel the tetrahedron and lay it flat. That pattern is called a net.
What do you think it will look like?
Ask your students to sketch their predictions for the net. They can check their predictions by making each net and folding it up to check.
There are two possible nets:
There is also an arrangement of triangles that does not work.
Why do the two top nets work but the bottom one does not?
The reasons why a net will not work are sometimes as important as the reasons why a net will work. All of the nets have four equilateral triangles. This is an essential condition. Nets that fold to make a tetrahedron allow only three corners of a triangle around each vertex when they fold. The bottom allows for four corners around the central vertex, so will not fold to make a tetrahedron.
How many different nets will there be for a cube?
Provide each pair of students with square grid paper and six square polydrons. Allow lots of time for the students to find and record possible nets.
Session Three
In this session students try to find a solution set for all the nets of a cube.
How many different nets can you make that will fold to make a cube?
Are these nets the same or different?
Students might notice that one net can be mapped onto the other by reflection or rotation, or both in this case. That means that the nets are not unique (different in a mathematical sense).
Has anyone got a system for finding all of the nets?
A provoking question might be:
Is it possible to make a net that has no more than three squares in a row?
What about only two squares in a row?
Gather the class and add to the gallery by asking students to come up with a ‘new’ net. Check each offering is not a reflected or rotated copy of another net. Polydron models are helpful for this as they can be turned and flipped to map onto each other.
Note that the top four nets fix the top-left square and move the right-hand square to different positions. The next two nets fix the left square to the second central square and find two new positions for the right square. The top-right and bottom-right positions have already been covered in the first four nets.
Another four nets can be found by organising three squares in a row and manipulating the other three.
The final net has no more than two squares in a row.
Use symmetry to form the net?
Divide the solid into two halves to simplify the task?
Fix one face as the base or top and imagine the other faces connected to it?
Image the folding of faces to locate them correctly?
Session Four
For example, the cube (hexahedron) has many possible views.
Session Five
In this session students create accurate nets for two families of polyhedral, called prisms and pyramids. They look for properties in the nets and consider the relative lengths of edges/sides.
How are these solids the same and how are they different?
Students should notice how all three solids have rectangular faces though the end faces are different (triangle, square and hexagon). Tell the students that the solids are examples of prisms, polyhedra with consistent cross section. Imagine that each solid was a loaf of bread. It is possible to slice the solid into pieces of the same shape.
Each prism is known by its cross section. For example, a triangular prism has triangular cross sections.
What will need to change in the net to form a triangular or hexagonal prism?
Do students recognise that the end faces will need to be triangles or hexagons and that the number of rectangles must match the number of sides? For example, a triangular prism will have only three rectangles. Invite your students to create nets for other kinds of prisms. The grid paper will still be useful though the challenge of getting the matching sides is more difficult.
What is the same with all of the nets?
What are the differences?
Imagine the net for an octagonal prism. What would it look like?
You could create a table of data about the prisms and look for patterns, or you may choose to keep the lesson focused on nets.
What shapes are in the net of this solid?
How do you know there will be four triangles?
Which sides will need to be the same length?
Students can make an accurate net for the square based pyramid or try the challenge of the more difficult pyramidal nets. The net for an octagonal pyramid is an excellent mid-level challenge. As with the prisms you might create a table of data and look for patterns.
Dear family and whānau,
This week we have been exploring polyhedra. Ask your student to explain how these solid shapes have faces, edges and vertices. For homework your student has been asked to either: