Students are presented with a food maker that makes disgusting-sounding food. Will you get a slimy sandwich or slimy sushi or even a bug burger?
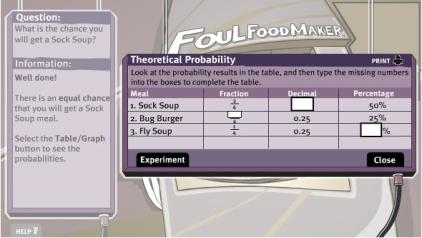
Students are first presented with the food maker and four different foods shown as possible outcomes. They select a word from a bank of five - impossible, unlikely, equal, likely and certain - to describe the chance of the food maker serving a particular food. Students select 'make' to see what is served. Selecting table/graph displays the theoretical probability in the form of a common fraction, a decimal fraction and a percentage. Students can choose to see what happens when 100 meals are served. This is displayed as a graph contrasting the theoretical result with the experimental result.