Using leisure activity data, students explore the complete survey process including the selection of appropriate questions to gather data as well as the analysis and display of data.
Teacher notes
- Students select a question that will provide appropriate data for a given topic. Responses for 500 interviews are then generated and displayed in a dynamic, sortable table. Students manipulate the table to find the correct answers to some interpretive questions.
- Students select an appropriate display format to represent the data: histogram, bar chart or pie chart then answer interpretive questions based on the graph.
- Includes a printable worksheet for students to complete an article based on the survey results.
Learning objects
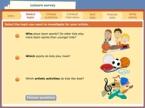 |
Leisure survey |