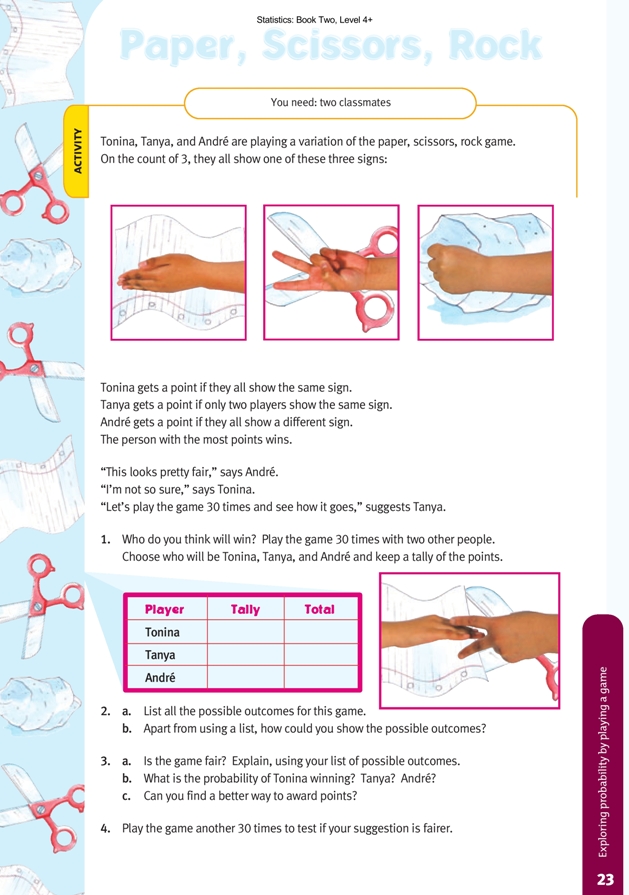
Paper, Scissors, Rock
This is a level 4 statistics activity from the Figure It Out series.
Click on the image to enlarge it. Click again to close. Download PDF (622 KB)
explore the outcomes in a probability game
list all possible outcomes
decide if a game is fair
calculate the theoretical probabilities
FIO, Level 4+, Statistics, Book Two, Paper Scissors Rock, page 23
Question 1 asks students to play a variation of the old paper, scissors, rock game while keeping a record of their results so that they can estimate the probabilities involved and determine the fairness of the scoring system.
In question 2a, the students should use a method that ensures they don’t miss any of the possible outcomes. The simplest method is to number the players 1–3, assume that player 1 chooses paper, then list each of player 2’s choices, matched each time with all of player 3’s choices. This gives {PPP, PPS, PPR, PSP, PSS, PSR, PRP, PRS, PRR}. By replacing player 1’s choice with scissors, then rock, the list of 9 outcomes becomes a complete list of 9 x 3 = 27 outcomes.
A tree diagram is the best alternative to a list of outcomes (question 2b). The first set of branches will represent the 3 choices open to player 1, the second set to player 2, and the third set to player 3. The students should label the end of each branch with the outcome it represents. The top branch will be PPP, and the bottom branch RRR.
Tree diagrams can get very crowded and difficult to draw. The students should therefore use pencil and do a little planning before they start. Sometimes an incomplete tree (as in the Answers) is sufficient to establish the pattern, and there is little added value in completing the entire tree if the other sections have an identical
structure. Most students will find that they can draw a tree diagram more quickly and more tidily if they use a computer drawing program. For other activities involving tree diagrams, see Family Feast and Catch of the Match, pages 17–18, Statistics: Book One, Figure It Out, Years 7–8.
In question 3, the students should realise that there is a different number of winning outcomes for each player. Therefore, the game is not fair. In question 3c, the students can change the number of points assigned to each of the winning outcomes so that each player does get a fair deal.
As in some of the earlier activities in this book, the students can explore the probabilities at stake by accumulating experimental results. This can be an effective way for them to gain confidence with probability.
Answers to Activity
1. Results may vary, but Tanya should win. (See the answer to question 3b.)
2. a.
PPP SPP RPP
PPS SPS RPS
PPR SPR RPR
PSP SSP RSP
PSS SSS RSS
PSR SSR RSR
PRP SRP RRP
PRS SRS RRS
PRR SRR RRR
(P is paper, S is scissors, and R is rock.)
b. A tree diagram would be suitable. The following is 1/3 of a complete tree. It shows all the outcomes from the 1st column of the list under a, above.
3. a. No. The players do not have an even chance of winning.
b. The probability of Tonina winning is 3/27, the probability of Tanya winning is 18/27, and the probability of André winning is 6/27 .
c. Ideas may vary, but Tonina should get twice as many points for each win as André, and André should get 3 times as many points for a win as Tanya. For
example, Tonina could get 6 points, André 3 points, and Tanya 1 point.
4. Practical activity