Which When?
This is a level 3 statistics activity from the Figure It Out series.
A PDF of the student activity is included.
Click on the image to enlarge it. Click again to close. Download PDF (1199 KB)
investigate probabilities using a spinner
compare experimental results with expectations
This diagram shows the areas of Statistics involved in this activity.
The bottom half of the diagram represents the 5 stages of the PPDAC (Problem, Plan, Data, Analysis, Conclusion) statistics investigation cycle.
Copymaster of the spinners
FIO, Levels 2-3, Statistics Revised Edition, Which When? pages 23
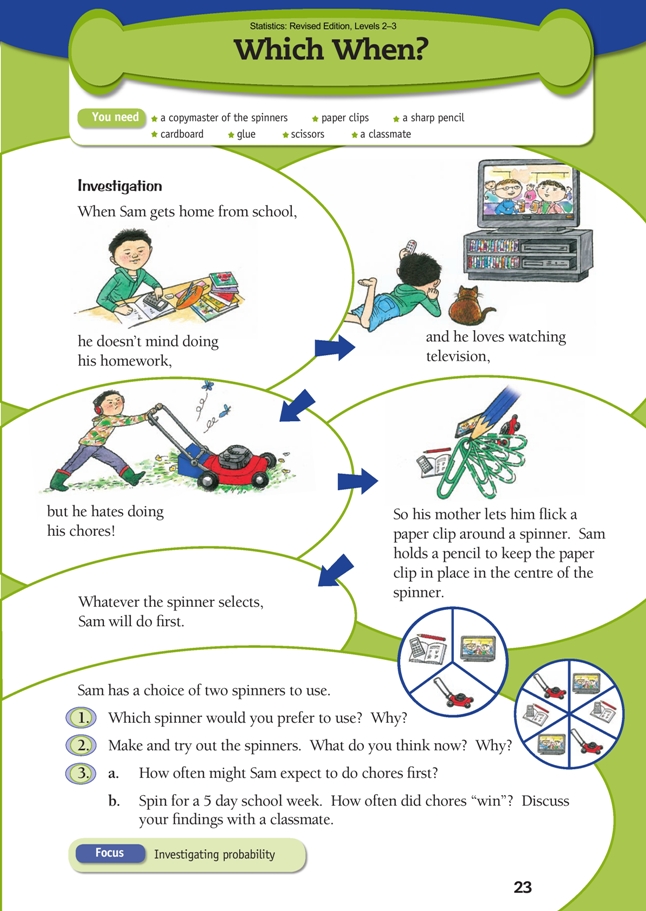
Investigation
This activity requires two spinners, for which patterns are provided in the copymaster. These are operated by flicking a paperclip around a pencil point. (An alternative is to make hexagonal spinners out of thin card and punch toothpicks through the centres. By using a hexagon instead of a circle, the paperclip will always stop in such a way that the outcome is obvious.)
Questions 1 and 2 invite the students to think about and then experiment with the two
spinners. Some may think that the spinner that is divided into 6 regions will give them more opportunities to get a preferred outcome. If this is the case, ask them to explain why and encourage students who hold the opposing view to engage with them in mathematical debate.
Unlike the previous activity involving the bottle top, the probabilities in this case can be determined mathematically: the sectors in the spinners are defi ned by identical angles. This means that the spinner has an identical chance of stopping at any of them. Each sector on the fi rst disc is one-third of the total disc. The sectors on the second disc are half that size, but there are two for each option, so each option still “owns” one-third of the whole.
Question 3 requests a 5-day simulation. This is too small an experiment to get meaningful data. But if students do a number of 5-day simulations and then pool their data with that of others, they will (a) see variation at work and (b) have enough data on which to make probability statements with some confidence.
When they have completed the set tasks, the students could be given the task of constructing spinners that favour particular outcomes, for example, a spinner that gives Sam a one to two (1:2) chance of getting to watch television (the spinner needs to have three equal sectors) or a one to three (1:3) chance of having to do homework (the spinner needs to have four equal sectors). (See the explanation of “ratio” in the activity below.)
Answers to Activity
Investigation
1. Some will prefer one and some the other, but it actually makes no difference to the outcomes.
2. Answers will vary, but because the total angle (and area and circumference) allocated to each of the activities remains the same (one-third of the total, in each case), it makes no difference which spinner is used. (You may need to decide that if the spinner lands on a line, the “win” is the area that most of the spinner is in.)
3. a. 1 day in 3
b. Answers will vary. While you might expect to get 1 or 2 days of each activity
over a 5-day period, anything can happen. It may be that your 5 spins got you chores
every time!
Key Competencies
Which When? can be used to develop these key competencies:
• thinking
• relating to others
• managing self.