Predicting ahead
The purpose of this activity is to support students in using a table of values and the spatial structure of a growth pattern to predict further shapes.
- Square tiles or squared paper
- PowerPoint (in paper form or displayed on a shared screen)
Use the PowerPoint as the source of growth patterns. The focus of this lesson is on predicting a further shape in the pattern, not the next shape.
Show the pattern on slide 2 of the PowerPoint and create a table of values, as shown below.
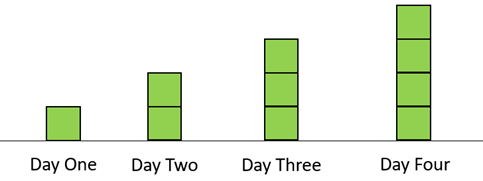
| Day | 1 | 2 | 3 | 4 | 5 | … | 9 |
| Number of squares | 1 | 2 | 3 | 4 | 5 | … | ? |
- Discuss the pattern and the table of values.
How many squares will be in the shape for Day 9? How do you know?
The table makes it obvious that the Day number and number of squares are the same for all days. Use slide 3 of the PowerPoint to develop a table of values in the same way. If using a shared screen, animate the slide as you fill in the table.
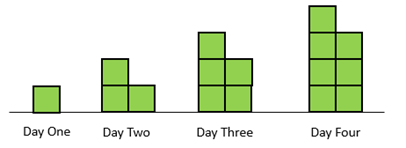
Day 1 2 3 4 5 … 11 Number of squares 1 3 5 7 ? … ? - Discuss the pattern and the table of values.
What patterns do you see in the number of squares?
Why does this happen?
Look for students to notice regularity, particularly that the numbers of squares are odd, and they go up by two each day.
How many squares will the plant have on Day 11? How do you know?
Students are likely to extend the table of values to work the problem out.
Focus on the spatial nature of the pattern as well:
What will the plant look like on Day 11? Can you draw the plant?
Using highlighter pens on squared paper will speed up the process. Students might draw the shape to confirm the prediction that the number of squares will be 21.
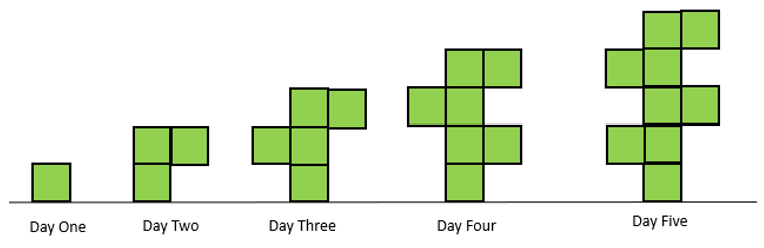
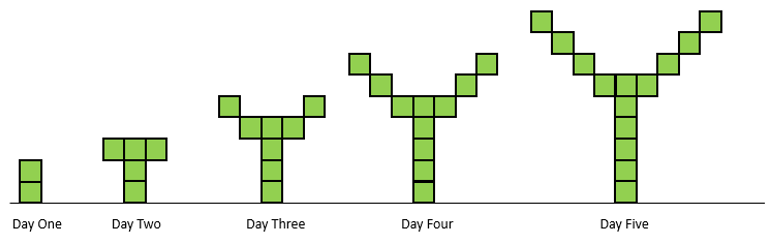
- Follow the same steps for the other two growth patterns in the PowerPoint. Be careful to balance the strategies of looking for structure in the pattern and creating a table of values. You may choose to ‘push out’ the day number target to encourage students to focus more of spatial structure and less on extending the table. Day 20 is a good target because function rules are easier to calculate. To apply function rules students will need to connect the day number with the number of squares in different parts of the shapes.
Answers are:
- The structure of the shape on the 20th day should be a central stem of 20 squares, 10 squares growing on the right, and 9 squares growing on the left. Students should notice that the number of squares grows by two for each increase in Day number.
| Day | 1 | 2 | 3 | 4 | 5 | … | 20 |
| Number of squares | 1 | 3 | 5 | 7 | 9 | … | 39 |
The structure of the 20th shape should be a central stem of 21 squares and branches left and right of 19 squares. The central stem square numbers are one more than the day numbers and the branches numbers of squares are always one less. 21 + 19 + 19 = 59. Alternatively, note that the number of squares increases by three for each extra day. The 20th day pattern will be made up of 2 + 19 x 3 = 59 squares, two representing the first shape (day 1) and 19 x 3 the addition of nineteen lots of three.
Day 1 2 3 4 5 … 9 Number of squares 2 5 8 11 14 … 59
Next steps
- Ask students to create their own growth patterns with squares and pose ‘predicting ahead’ problems for their classmates to solve. Allow students to work in groupings that will encourage peer scaffolding and extension. Some students might benefit from working independently, whilst others might need further support from the teacher. Consider also the different means of action and expression (e.g. verbal, written, digital, material) that your students might use to build and describe their patterns.
Explore rule finding from tables of values alone. You might use the context of the function machine in which numbers enter the machine, the same operation/s are performed, and numbers exit the machine. For example:
What rule is the function machine using?In Out 1 5 5 25 8 40 … … 10 ?