Container Contents
This is a level 2 number link activity from the Figure It Out series. It relates to Stage 5 of the Number Framework.
A PDF of the student activity is included.
Click on the image to enlarge it. Click again to close. Download PDF (250 KB)
explore multiplication and division basic facts
FIO, Link, Number, Book One, Container Contents, page 13
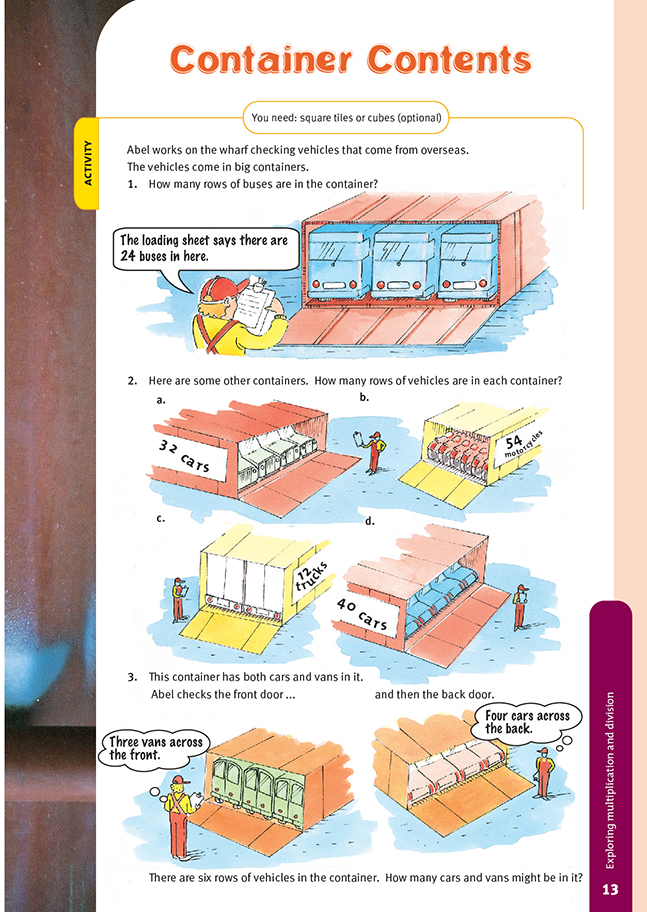
square tiles or cubes (optional)
This activity asks the students to visualise arrays of cars stored in the big containers. They also need to realise that an array is the product of two factors. For questions 1 and 2, the students will know the total size of each array because it is given each time as the number of vehicles in the container. They also know one of the factors in the array because they can see one of its sides. Their task is to find the other factor,
which is the other side of the array.
One way of describing the problems in questions 1 and 2 is to write them as start-unknown equations, for example, x 4 = 32. The students can solve this through multiplication as “What times 4 equals 32?” or through division as “32 divided by 4 equals what?”
Students who have difficulty visualising the arrays could model them using cubes or square tiles as vehicles. They should see that each array starts with a particular number of cubes (vehicles) and builds up in rows of the same number of cubes until it reaches the total number.
Question 3 is a great open-ended question that will encourage visual thinking. Have your students discuss the information provided and draw conclusions about the implications of the facts. If they are struggling, suggest that they draw a diagram to show what they know.
There are three certain known facts: there are six rows of vehicles, there is at least one row of cars, and there is at least one row of vans. However, somewhere within the container, the number of vehicles in the row changes from three to four. This means that there could be five possible arrangements. A table or diagrams to show all the possible ways of arranging the cars and the vans would be a good strategy and would enable the students to visualise what is happening.
Another approach is to ask the students to find how many rows of vans would give them the most vehicles (one) and how many rows of vans would give the least vehicles (five).
Answers to Activity
1. 8
2. a. 8
b. 9
c. 6
d. 8
3. Answers will vary. You could use a table to show the various options: