Whānau Photo
This is a level 3 algebra strand link activity from the Figure It Out series.
A PDF of the student activity is included.
Click on the image to enlarge it. Click again to close. Download PDF (231 KB)
interpret relationships from a graph
FIO, Link, Algebra, Book One, Whānau Photo, page 21
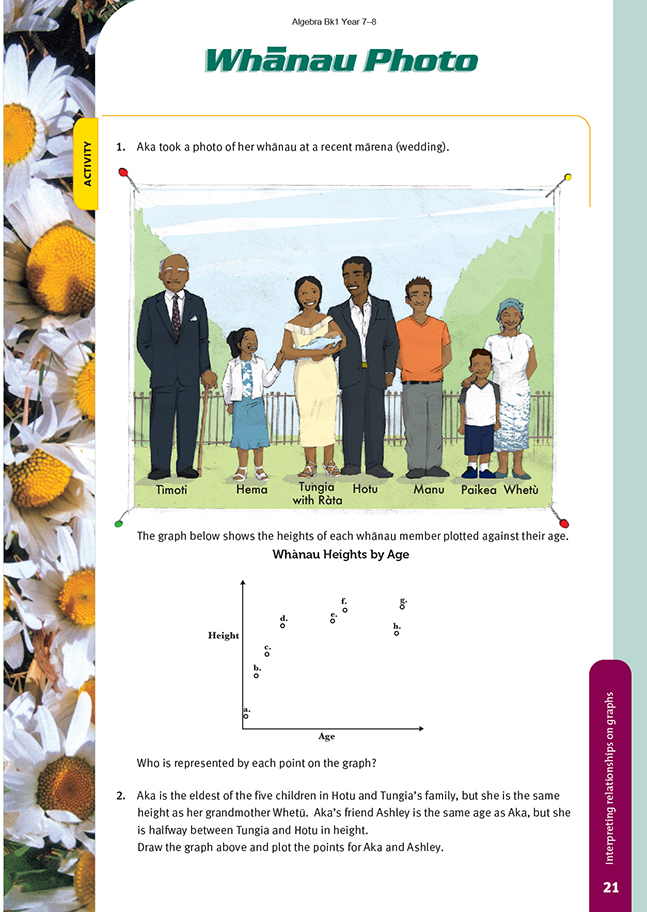
This activity shows the students how the distinctive features of an everyday situation, provided by a photograph of a whànau, can be represented graphically. These features, or variables, are age and height. The lack of any scale for age and height means that the students must focus on the relationships between the variables.
Note that for the children represented by the points a, b, c, and d, height is mostly dependent on age, but for the adults, e, f, g, and h, height is related primarily to gender rather than to age.
In question 1, the students should be encouraged to explain their reasoning for choosing the person represented by each point.
In question 2, the students should also explain their reasoning for positioning the points for Aka and Ashley. In the graph below, any point on the horizontal line through h (Whetù), represents a person who is the same height as Whetù. Aka is the same height as Whetù, so the point for Aka is on the horizontal line. Aka is also
older than Manu (d) so the point for Aka is on the horizontal line but to the right of the point for d.
Ashley is the same age as Aka, so the point for Ashley lies on the vertical line that passes through the point for Aka. Ashley’s height is also halfway between Hotu’s height (f) and Tungia’s height (e). So the point for Ashley lies on the vertical line in a position midway between the points e and f.
Answers to Activity
1. a. Rata
b. Paora
c. Mere
d. Manu
e. Aroha
f. Hōne
g. Timoti
h. Huia
2. Your graph should be similar to the graph below.
Whānau Heights by Age