Burning Issues
This is a level 3 measurement strand activity from the Figure It Out series.
A PDF of the student activity is included.
Click on the image to enlarge it. Click again to close. Download PDF (535 KB)
interpret temperature charts
classmate
This activity will encourage sound reasoning in a temperature, location, and weather conditions context. It also has important implications for health and physical education.
There is plenty of scope in this activity for class discussion of UV radiation and how it affects us. New Zealanders experience relatively intense sunburning ultraviolet (UV) rays, and students need to be aware of the dangers of this. The World Meteorological Organization and the World Health Organization now recommend using the UV index rather than burn time. The information below was provided by the National Institute of Water and Atmospheric Research Ltd (NIWA). It is included here as necessary background for the activity.
New Zealand was the first country (1989) to begin informing the public about the dangers of UV radiation. This information was provided to the media by the New Zealand Meteorological Service as a “time to burn” and was based on calculations assuming clear-sky conditions. Unfortunately, time to burn is a poorly defined quantity, which varies greatly from person to person. A new international standard, called the UV index, was introduced in New Zealand in the summer of 1994/95. It is based on UV intensity, so that when UV radiation is more intense, the index is higher (unlike burn time, which decreases with intensity). The UV scale is open-ended, but a UV index of greater than 10 is extreme, and a UV index less than 1 is low.
Students may still hear UV radiation being reported as burn time, and this activity is a good way of helping them understand why this is not as useful as the UV index.
Students need to understand the following points:
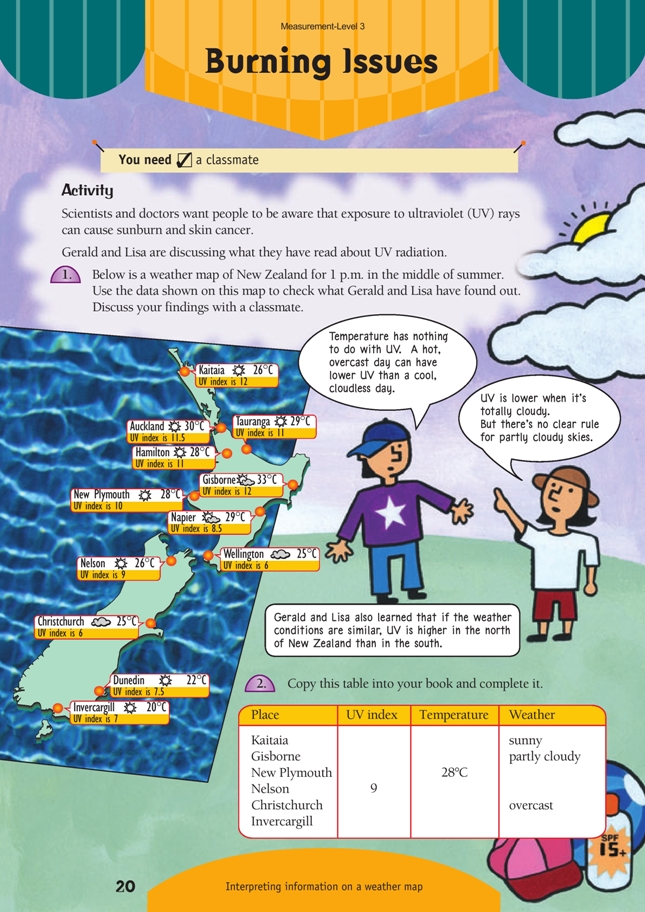
- If weather conditions are similar, UV levels are higher in the north of the country than in the south because in the north of the country, the sun is higher in the sky than in the south of the country at the same time of the day. When the sun is higher in the sky, the path through the atmosphere is shorter and therefore less of the sunlight is absorbed by the atmosphere.
- When it’s sunny and there are no clouds in the sky, the UV level is high.
- When it’s sunny but there are some clouds in the sky, UV levels can be higher or lower than if there are no clouds. This depends on whether the sun is partly obscured by cloud. On a partly cloudy day when there is no cloud in front of the sun, the UV level is higher than on days that have completely clear skies. (Clouds can reduce UV radiation by reflecting light rays back into space, but during partly cloudy conditions when the sun is not obscured, UV levels can increase by more than 20% because the clouds scatter the UV rays. When cloud is partly obscuring the sun, the UV level is lower at that point.)
- When it’s totally overcast, the UV level is lower than it would be if there were no clouds in the sky.
- Temperature has nothing to do with UV levels. A hot, overcast day can have a lower UV level than a cool, cloudless day at the same time of the year.
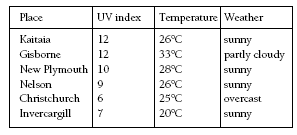
Students will need to look carefully at the data supplied on this page. By looking at the UV indices for the cities with sun only, that is, Kaitaia, Tauranga, Auckland, Hamilton, New Plymouth, Nelson, Dunedin, and Invercargill, they can conclude that the UV level was higher in the north of the country than in the south on that day.
They can then see that the UV level was lower in Christchurch because it was totally overcast. This is also apparent by comparing Wellington (overcast) with Nelson and New Plymouth, the closest sunny cities on that day. Gisborne had a higher UV index than you might expect. (It had a UV index of 12, whereas Hamilton, to the north, had 11, and New Plymouth, to the south, had 10.) This is because it was partly cloudy,
which, as explained above, can make the UV level higher than clear-sky levels. However, note that in Napier, the partly cloudy skies suppressed UV. Students can assume from this that at 1 p.m. on that day, the sun was covered by cloud.
Answers to Activitiy
1. Answers will vary, but they should include comment about what causes sunburn and the influence of the clouds.
2.