Cars
In this unit students investigate variables associated with cars, using a spreadsheet to produce data displays and investigate distributions.
- Plan an investigation to collect numerical data.
- Collect and collate data.
- Use technology to display data.
- Discuss features of data display.
- Compare features of data distributions.
This unit involves students collecting data and analysing them in a variety of ways using technology. The focus of the unit is to explore relationships between numerical variables, but this does not exclude looking at summary and comparison situations.
Criteria for developing good investigative questions
As students develop questions within the investigation cycle, they must be supported to clearly see and understand the difference between investigative questions (questions we ask of the data) and the survey or data collection questions (questions we ask to get the data) that will generate the data to answer the investigation question(s). Broad ideas should be refined in order to generate investigative questions. The purpose of each of these question types should be made explicit within the context of the investigation.Teachers should support the development of such questions through questioning and modelling.
Arnold’s (2013) research identified six criteria for what makes a good investigative question. At curriculum Level 4, students should be introduced to the criteria, potentially through “discovering” them. See for example, the following lesson on CensusAtSchool New Zealand https://new.censusatschool.org.nz/resource/posing-summary-investigative-questions/ .
The six criteria are:
- The variable(s) of interest is/are clear and available or can be collected
- The group of interest is clear
- The intent is clear (e.g. summary, comparison, relationship, time series)
- The investigative question can be answered with the data (e.g. question is specific, data can be collected, ethics)
- The investigative question is one that is worth investigating, that it is interesting, that there is a purpose
- The investigative question allows for analysis to be made of the whole group.
Categorical variables
Categorical variables classify individuals or objects into categories. For example, the method of travel to school, or the colour of students' eyes.
Numerical variables
Numerical variables include variables that are measured e.g. the time taken to travel to school, and variables that are counted e.g. the number of traffic lights between home and school. Measured numerical variables are called continuous numerical variables. Counted numerical variables are called discrete numerical variables.
Scatterplots
A scatterplot is a display for paired numerical variables. At this level we are not concerned with which variable goes on which axes or with defining explanatory and response variables.
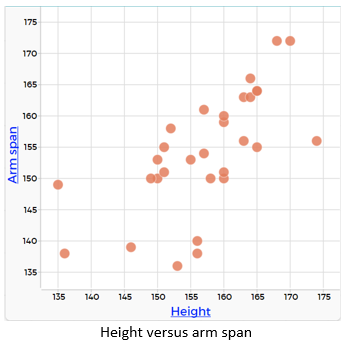
The scatterplot below shows how the heights and arm spans of a sample of students might be graphed (from CensusAtSchool).
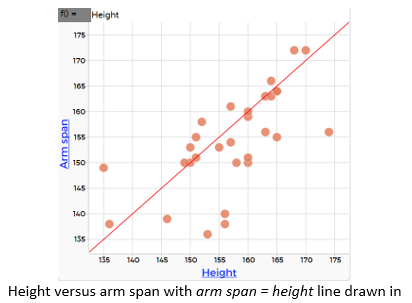
Analysis of scatterplots at this level includes looking at situations where the variables might be equal e.g. height and arm span. If this is the case the y=x line can be drawn in (as shown below), and a discussion can be led around the areas of the graph – above the line, below the line, on the line – and the closeness of the points to the line is appropriate.
This discussion might include the following points:
- We can describe the data on the line: four of the students have height and arm span the same. We can describe the data above the line: ten students have a longer arm span than their height, most of this data is quite close to the line meaning that the arm span is not a lot greater than their height.
- We can describe the data below the line: 16 students have a shorter arm span than their height, while some of the data is close to the line. We notice that some of the data has a difference of 15-18 cm between height and arm span. This seems like quite a big difference to us. We wonder if there was an issue with measuring the arm spans.
- We notice that as the height increase so does the arm span. This might be because taller people have longer arm spans and shorter people have shorter arm spans.
- We can describe this as quite a strong relationship as many of the data values are close to the arm span = height line.
Analysis at this level can also involve looking at the relationship between two numerical variables that might not be equal. For example, if we look at wrist circumference and popliteal length. In this case the wrist circumferences range from 10-23 cm and the popliteal lengths range from 30-60cm. 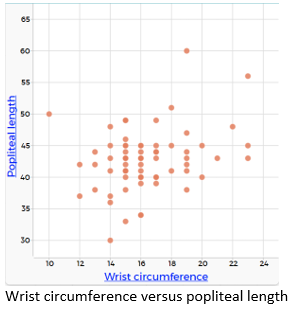
In this situation we can draw in two boundary lines that broadly encompass the data points.
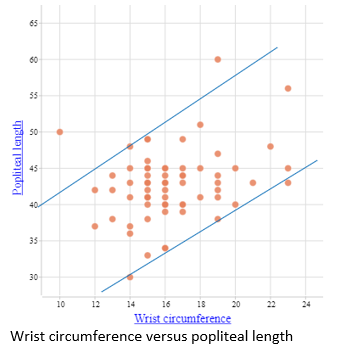
In this case we can describe the general pattern – that those with a greater wrist circumference also tend to have longer popliteal lengths. We can also identify that the data is quite widely spread and for many wrist circumferences there are multiple popliteal lengths.
The learning opportunities in this unit can be differentiated by providing or removing support to students and by varying the task requirements. Ways to support students include:
- varying the type of data collected; categorical data can be easier to manage than numerical data
- focusing on summary situations
- varying the type of analysis expected– and increasing or decreasing the support given to do the analysis
- setting up blank CODAP documents with the data already filled, and some blank graphs ready to use for students
- providing prompts for writing descriptive statements
- providing opportunities for small group teaching, flexible groupings, and peer-support
- providing teacher support at all stages of the investigation.
The context for this unit can be adapted to suit the interests and experiences of your students. For example:
- the statistical enquiry process can be applied to many topics and selecting ones that are of interest to your students should always be a priority. Consider how this topic, or an alternative one, will allow students to make links to their cultural backgrounds, their knowledge and interests, current events, and learning from other curriculum areas
- this unit of work focuses on cars as an overall topic, within the topic of cars options for looking at new cars, second-hand cars, vintage cars are all possible; other vehicle types could be explored, e.g. motor cycles, electric cars only, diggers and other construction vehicles, a particular type of car e.g. SUVs, sports cars, utes. This might form part of a wider unit focused on transportation.
Te reo Māori kupu such as taunga (statistics), taurangi (variable), raraunga (data), taurangi motumotu (discrete variable), taurangi motukore (continuous variable), and tūhura (investigate) could be introduced in this unit and used throughout other mathematical learning.
- CODAP file for Audi cars
- Access to the internet and graphing software
Session 1: Deciding on our topic and planning to collect data
PROBLEM: Generating ideas for statistical investigation and developing investigative questions
- Present the context for the unit and discuss what kind of data the class could collect to find out about cars. This could include:
- Performance of cars
- Safety of cars
- Second-hand cars
- New cars
- Colours of cars
- Identify variables, including: number of cylinders, Horse Power (HP), weight, km per litre of petrol, acceleration 0-100 km, ANCAP safety ratings, AEB (automatic emergency braking) and LSS (lane support systems), mileage (second hand cars), selling price (new and second hand).
- For each potential variable identify if it is categorical or numerical. For numerical variables identify if they are discrete (counted) or continuous (measurement). Support your students to understand the difference between these terms by proposing different investigations that could be done in your classroom (e.g. how do we travel to school in the morning), and classifying the variables related to these theoretical investigations (e.g. method, time taken, number of streets crossed).
- Explain that we want to explore relationships between paired numerical variables.
This means we need to identify variables that can be measured. - In groups, students are to select an idea or area to explore further. Encourage and support students to pose investigative questions where they explore the relationships between two numerical variables. The investigative questions should be ones they would like to know the answer to about car performance/safety etc. For example:
- Does having more cylinders mean increased HP?
- Is larger HP associated with worse km per litre performance?
- Does a high adult occupant protection rating also mean there is a high child occupant protection rating in cars?
- Is there a relationship between vulnerable road user protection and safety assist for the ANCAP safety ratings? Etc
- Or for second-hand cars
- Do second-hand cars with lower mileage cost more?
- Are older second-hand cars cheaper?
- Direct groups to interrogate their investigative questions by asking the following questions. You could model the effective interrogation of one group’s investigative question, before asking students to apply the criteria to their own questions:
- Is the variable clear? (refer criteria 1)
- Is the group we are investigating clear? (refer criteria 2)
- Is the question purposeful? (refer criteria 5)
- Is the question about the whole group? Check that the question is not just asking for a yes or no answer or about an individual e.g. fastest 0-100km time (refer criteria 6).
- Is the question one that we can collect data for? (refer criteria 4)
- Is it clear whether the question is a relationship investigative questions (paired numerical variables), a summary investigative question (about a single variable) or a comparison investigative question (a single variable compared across two or more groups)? (refer criteria 3)
PLAN: Planning to collect data to answer our investigative question
- Direct students to identify the variables they need to find through internet searches and other paper-based resources e.g. newspapers etc. They should also identify the sources from they can collect data.
- As a class agree to work together to collect the information for all groups.
- Ensure some demographic data is also collected about the cars if the students have not already mentioned it e.g. make and model of car, for used cars the year of registration. Things to collect just in case as often once the analysis starts other investigative questions arise that can be answered if the variables are available.
- Direct students to set up spreadsheet(s) to collate the data into and share across the class. You may need to model this through whole-class or small-group teaching. It might be that more than one spreadsheet is needed depending on the data to collect. For example investigating second-hand cars might require quite different variables to investigating performance and safety of new cars.
Session 2: DATA: Collecting and organising data
- Direct students to help select data to be collected as a class. Each student should be encouraged to collect data from four cars for the variables identified (these should include ANCAP safety ratings for use in the next session). This can be from information available online.
- Once students have found the requisite information, they should enter it into the class spreadsheet.
Between this session and the next, import tthe data collected by students into CODAP and share it with the students. Information on importing data into CODAP can be found here.
Session 3: ANALYSIS: Using an online tool to make data displays
In this session the students will be using an online tool for data analysis. One suggested free online tool is CODAP. Feel free to use other tools you are familiar with. This session is written with CODAP as the online tool and assumes that students are familiar with CODAP.
If your students are unfamiliar with CODAP see:
- Session 5 of Planning a statistical investigation (Level 3) for an introduction to using CODAP.
- You could use the Getting started with CODAP example which has a built-in video that shows the basic features of CODAP and gets you started using the tool. Other support videos can be found here.
The main features that students need to be familiar with is how to draw a graph in CODAP.
- Share the class data with the students by giving them the link to the CODAP document that has all the data loaded.
- Remind students to save their document before they start doing any of their analysis.
- Allow the students five mins to have a play with the data, making graphs of any of the variables they want. This is to refamiliarise themselves with the data set and with CODAP.
- Introduce scatterplots by selecting a pair of variables to graph. For example, ANCAP safety ratings for Audi cars, including data on whether they have AEB or LSS has been collected and are available at this link. This could be a good demonstration data set for the teacher.
- Explore an example with the students, identifying the important features of the graph, before allowing students to choose pairs of numerical variables to graph and describe to answer their own investigative questions.
For example, Does a high adult occupant protection rating also mean there is a high child occupant protection rating in Audi cars?- Discuss with the students which variables to graph, and the group we are interested in to answer this investigative question.
- Discuss also how these ratings are made (information can be found online).
Ask the students to predict what they think the graph will show, do they expect that the adult occupant protection will be higher? Will the child occupant protection be higher? Or will they both be about the same? - Using CODAP, make a graph to show AOP% and COP%. When using scatterplots for values that we expect to be similar it is useful to make the scales the same on both axes (i.e. starting at 65 and increasing in intervals of 5, as shown below).
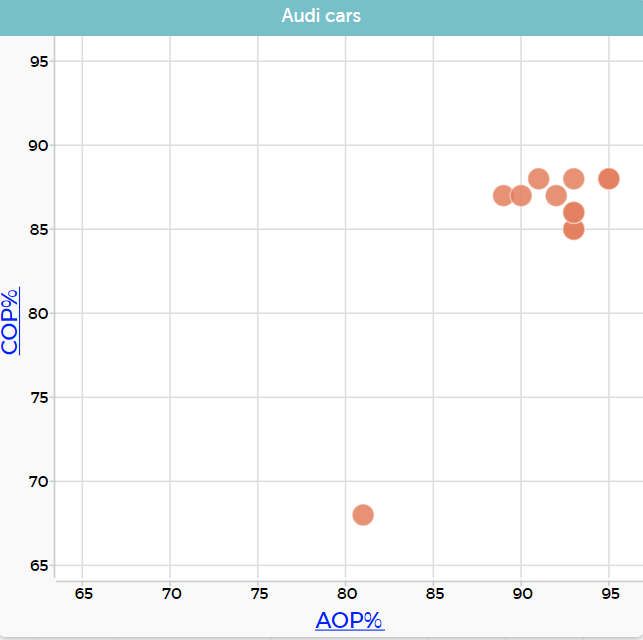
- Ask students what the notice about the data in the graph? They might notice that most of the data is grouped together in the top right of the graph, and that there is an outlier. By clicking on the outlier, they can identify this as the Audi TT. Depending on their knowledge of cars the fact that the COP% is low might make sense as the TT is a sports car and probably not designed for children.
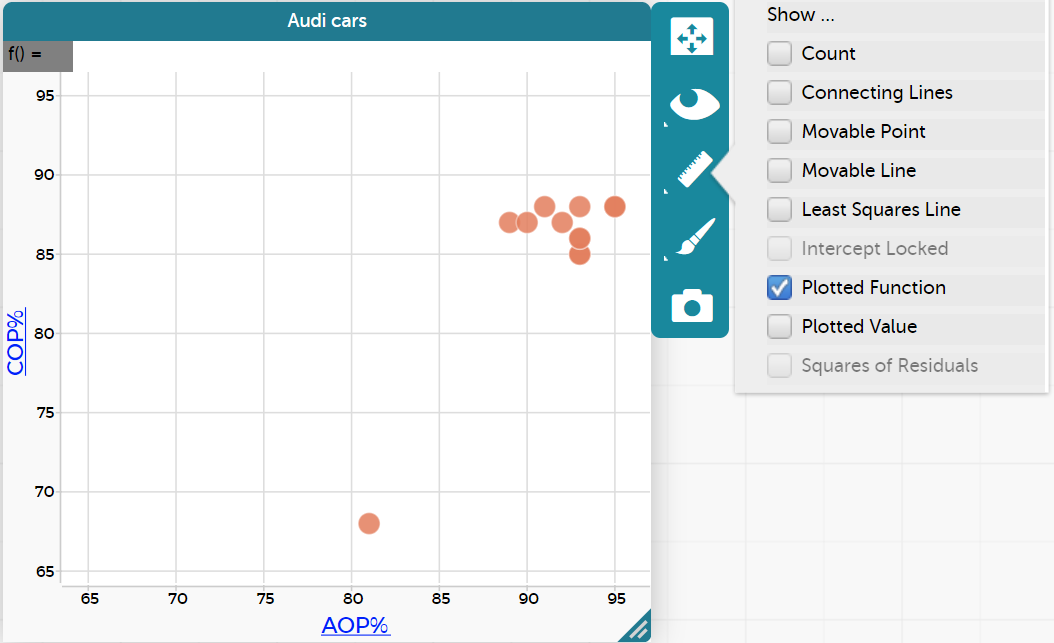
- As these two variables are both percentages, we can look whether they are equal or not to answer our investigative question. We do this by plotting the COP%=AOP% (y=x) line. Click on the graph in CODAP. Select the ruler and select plotted function. You will notice that in the top left corner in a grey box it has f( )=.
- We want to graph COP%=AOP%. Click on the grey box and a pop-up window appears. We want this to = AOP%. Start to type AOP and the variable will pop up in a smaller box. Select this and in the pop-up window ‘AOP%’ will appear in pink. Select "apply".
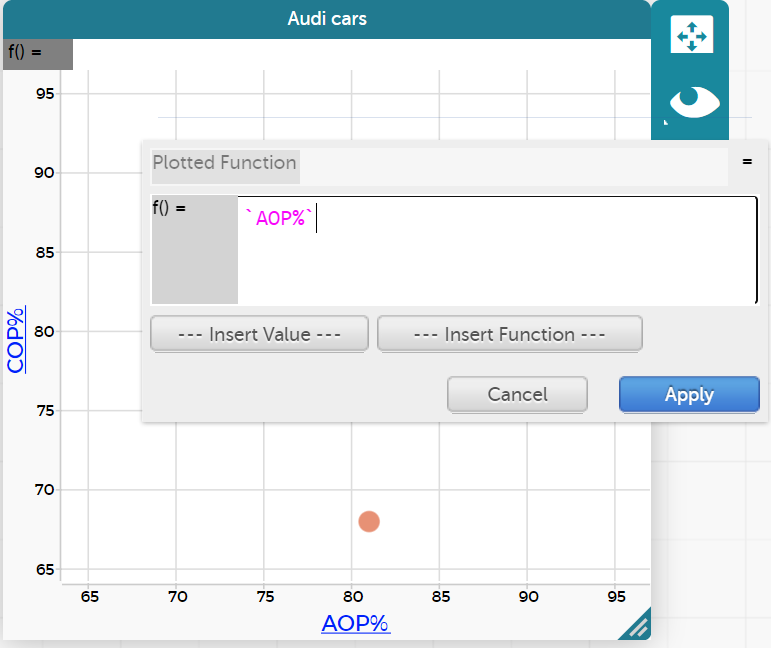
This will show the line COP%=AOP% in the graph.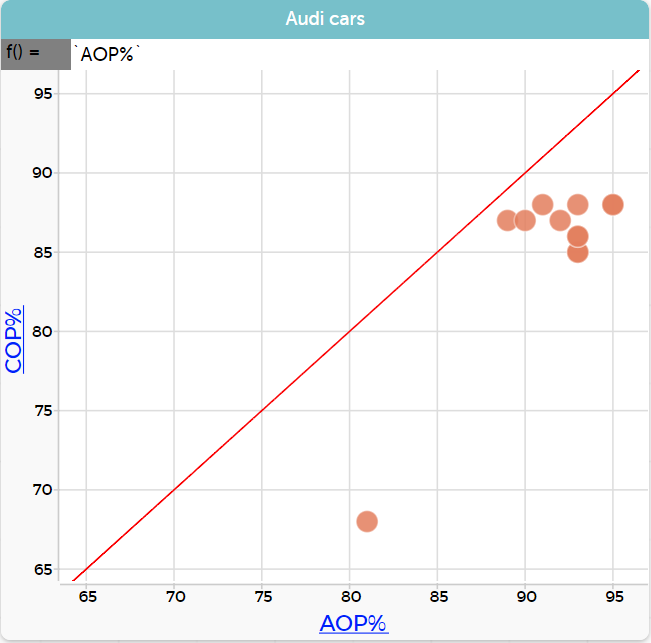
- From this we can notice that for all models of Audi cars the child occupant rating is lower than the adult occupant rating as all of the points are below the line, in the area of the graph where the AOP% is greater than the COP%. Ask students to discuss whether they think this is true for all makes of cars. If we have the data, should can we, and should we, this new investigative question (you should have the data if the students have collected this information in the previous session).
- Allow students time to explore this investigative question with the data they collected as a class. The investigative question will be slightly adapted as they may be looking at many makes of cars, or another specific make of car.
Does a high adult occupant protection rating also mean there is a high child occupant protection rating in ______ cars?
ANALYSIS: Graphing and describing our data to explore our investigative questions
- In this session, students explore their own investigative questions by making graphs to display the data and then writing descriptions about what the data show. Remind them to use the variable and the group in their descriptions and where relevant values and variables. From this we can notice that for all models of Audi cars [group] the child occupant protection rating [variable] is lower than the adult occupant protection rating [variable] as all of the points are below the line, in the area of the graph where the AOP% is greater than the COP%.
- Direct students to copy their graphs into a digital document (e.g. using Microsoft PowerPoint or Word) and write their descriptions underneath. If time permits, students could also express their mathematical thinking through another means (e.g. video, verbal presentation).
Session 4: CONCLUSION: Communicating our findings
In this session students finish their analysis, prepare, and then present to the class.
- Students are to prepare to present to the class using PowerPoint or google slides, following the criteria set out below. Limit the presentation up to 5 slides. This session could be linked with learning in English around explanation writing and oral language presentations.
- Their investigative questions
- Display 1 with description
- Display 2 with description
- Display 3 with description
- Answer to their investigative question
- Students present their findings.
Session 5: Exploring existing data displays to supplement their investigations
In this session students explore Figure NZ to find other displays of information about cars. They select at least three that interest them to explore and describe.
- Direct students to Figure NZ (https://figure.nz/)
- Show them how to search – type in cars
- Let them explore for a bit and then direct them to select at least three graphs that interest them.
- Direct students to download a graph and paste it into a slide show and then describe what the data is showing. They should refer to the information about the data to help with this. They should also identify anything unusual and should explore deeper to see if they can find an explanation for this.
For example, Monthly registrations of new and ex-overseas cars in New Zealand June 2015-June 2020 (graph from Figure NZ).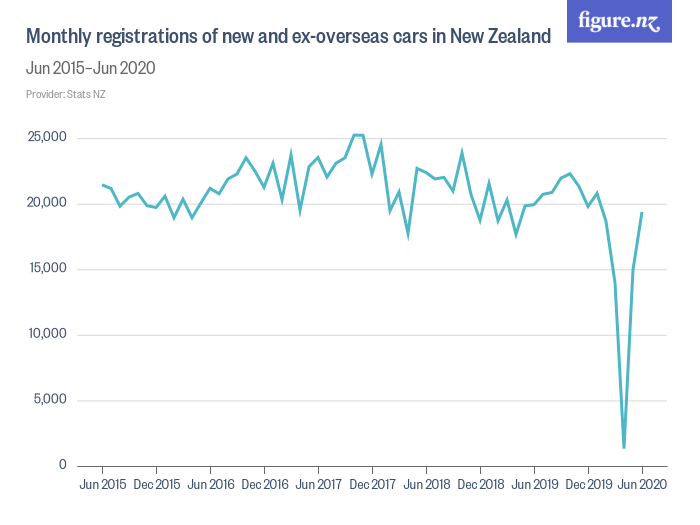
Students will notice the huge drop in April 2020, the actual graph on the website allows them to scan the graph and get exact values for monthly registrations (April was 1329 compared with March which was 13,980 registrations and May which was 14,965 registrations). They can comment on why this was so. (COVID-19 lockdown in New Zealand).
- Get some students to share their presentations.
Dear parents and whānau,
In mathematics we have been investigating data about cars. We have collected and collated data, displayed it on graphs, and have discussed the different features of it. Your child will share their presentation with you at home. Can you see any interesting features in the data?
Thank you.